
Figures & data
Figure 1 Representative picture of immunohistochemical staining of BTLA and HVEM in gastric tissues.
Notes: (A) Negative BTLA expression in adjacent normal specimen. (B) Low BTLA expression in gastric cancer. (C) High BTLA expression in gastric cancer. (D) Negative HVEM expression in adjacent normal specimen. (E) Low HVEM expression in gastric cancer. (F) High HVEM expression in gastric cancer. Magnifications: ×400.
Abbreviations: BTLA, B- and T-lymphocyte attenuator; HVEM, herpesvirus entry mediator.
Abbreviations: BTLA, B- and T-lymphocyte attenuator; HVEM, herpesvirus entry mediator.
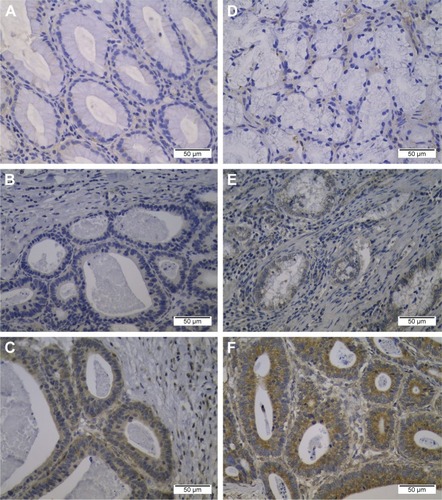
Table 1 Association between BTLA and HVEM expression and clinicopathological factors of gastric cancer patients
Table 2 Relationship between BTLA and HVEM expression in gastric cancer
Figure 2 Kaplan–Meier curves of OS based on BTLA expression in patients with gastric cancer.
Notes: Higher expression of BTLA was closely correlated with poor OS (P=0.001).
Abbreviations: OS, overall survival; BTLA, B- and T-lymphocyte attenuator; Cum, cumulative.
Abbreviations: OS, overall survival; BTLA, B- and T-lymphocyte attenuator; Cum, cumulative.
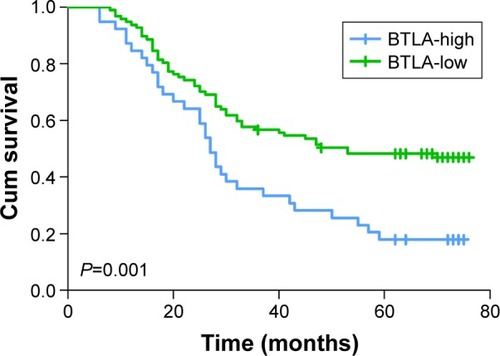
Figure 3 Kaplan–Meier curves of OS based on HVEM expression in patients with gastric cancer.
Notes: Higher expression of HVEM was closely correlated with poor OS (P<0.001).
Abbreviations: OS, overall survial; HVEM, herpesvirus entry mediator; Cum, cumulative.
Abbreviations: OS, overall survial; HVEM, herpesvirus entry mediator; Cum, cumulative.
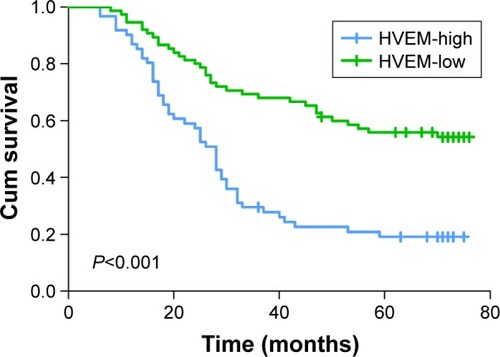
Table 3 Univariate and multivariate analysis of the prognostic factors in 136 patients with gastric cancer