
Figures & data
Figure 1 Flow diagram of the selection process.
Abbreviations: NHL, non-Hodgkin lymphoma; HL, Hodgkin lymphoma.
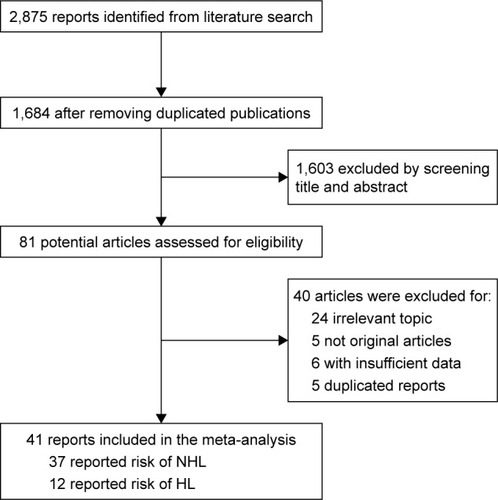
Figure 2 Association between history of allergic conditions and the risk of NHL.
Abbreviations: CI, confidence interval; NHL, non-Hodgkin’s lymphoma; OR, odds ratio.
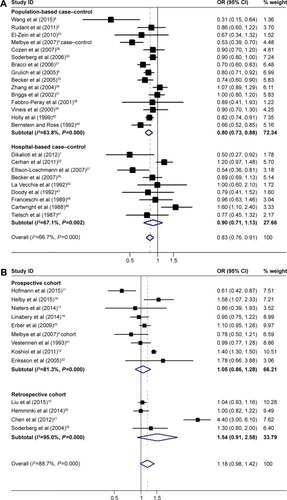
Table 1 Association between history of allergic conditions and the risk of NHL/HL according to study design
Figure 3 Association between several specific allergic conditions and the risk of NHL.
Abbreviations: CI, confidence interval; NHL, non-Hodgkin’s lymphoma; OR, odds ratio.
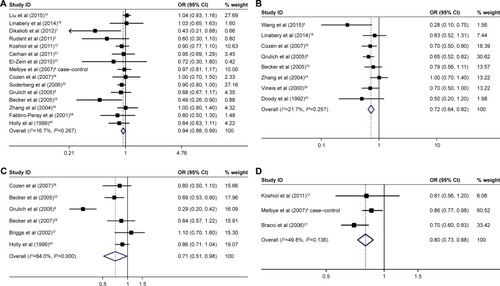
Table 2 Association between history of specific allergic conditions and the risk of NHL
Table 3 Association between history of allergic conditions and the risk of NHL according to the type of NHL and geographic region
Figure 4 Association between history of allergic conditions and the risk of HL.
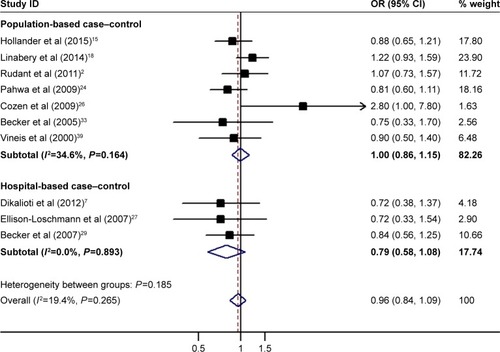
Table 4 Association between history of allergic conditions and the risk of HL according to the type of allergic conditions and geographic region