
Figures & data
Figure 1 Organ metastases.
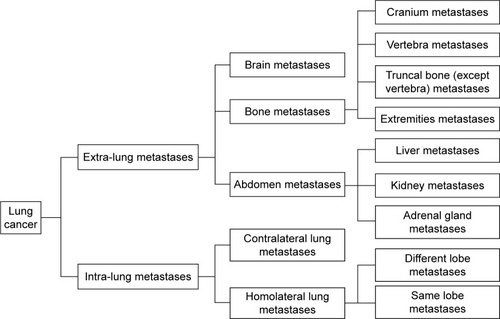
Figure 2 (A) ECTCs possessing only epithelial molecular markers (EpCAM and cytokeratin 8/18/19) were stained with red immunofluorescence. (B) EMCTCs having both epithelial and mesenchymal molecular markers were stained with both green and red immunofluorescent dyes. (C) MCTCs occupying only mesenchymal molecular markers (vimentin and Twist) were stained with green immunofluorescence. (Bars =2.5 µm).
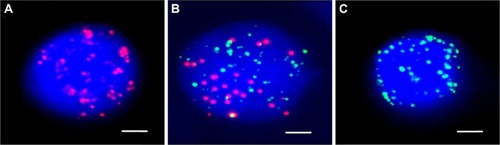
Figure 3 Twenty-seven out of 31 patients were detected with CTCs. The levels of EMCTCs predominated within the three CTC subpopulations among 16 patients and the levels of EMCTCs were equivalent to ECTCs count or MCTCs count among three patients.
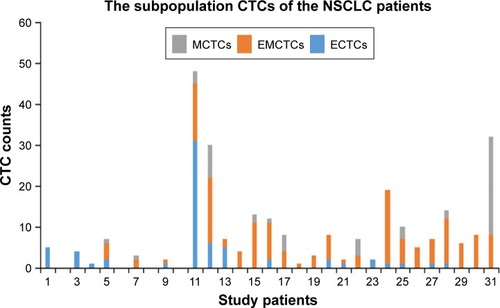
Table 1 CTCs and the general characteristics
Table 2 CTCs and disease-related characteristics
Table 3 CTCs and organ metastases
Figure 4 (A) Kaplan–Meier life-table analysis showed EMCTCs were associated with worsened clinical outcomes. (B) Kaplan–Meier life-table analysis showed MCTCs had negative prognostic value.
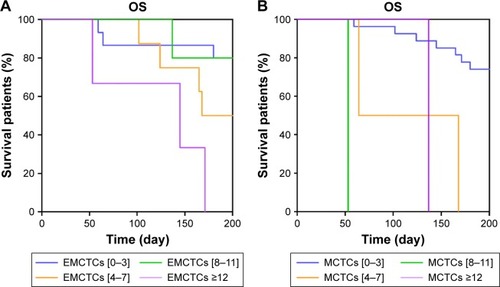
Table 4 Cox regression of overall survival
Table 5 Correlations of T-cell–related CD and CTCs