Figures & data
Figure 1 Selection criteria of the included studies.
Abbreviations: IFRT, involved-field radiotherapy; ENI, elective nodal irradiation; ASTRO, American Society for Radiation Oncology.
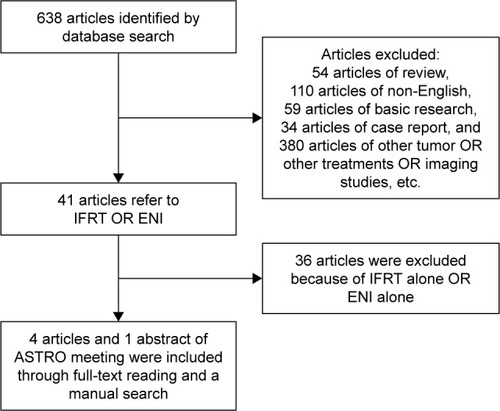
Table 1 Basic characteristics of the included studies
Figure 2 Forest plots comparing OS and median OS time outcomes for IFI and ENI.
Abbreviations: OS, overall survival; IFI, involved-field irradiation; ENI, elective nodal irradiation; RR, risk ratio; M–H, Mantel–Haenszel; CI, confidence interval; SE, standard error; IV, inverse variance.
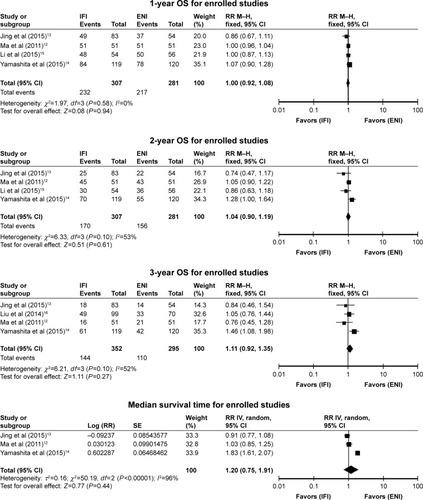
Figure 3 Forest plots comparing LCR outcomes for IFI and ENI.
Abbreviations: LCR, local control rate; IFI, involved-field irradiation; ENI, elective nodal irradiation; RR, risk ratio; M–H, Mantel–Haenszel; CI, confidence interval.
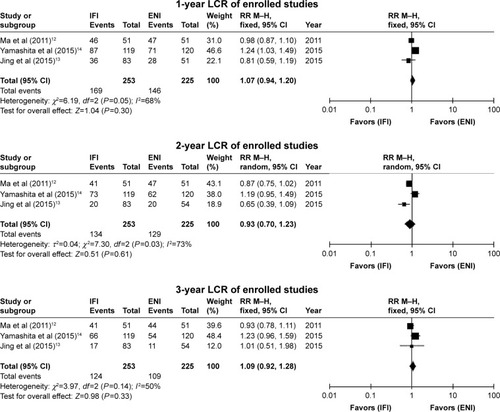
Figure 4 Forest plots comparing patterns of treatment failure for IFI and ENI.
Abbreviations: IFI, involved-field irradiation; ENI, elective nodal irradiation; RR, risk ratio; M–H, Mantel–Haenszel; CI, confidence interval.
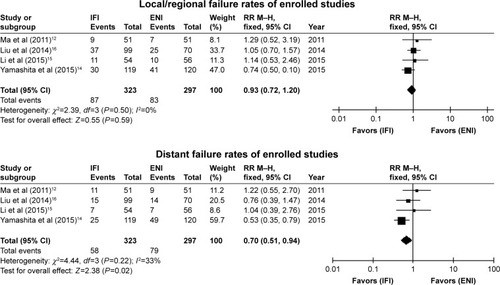
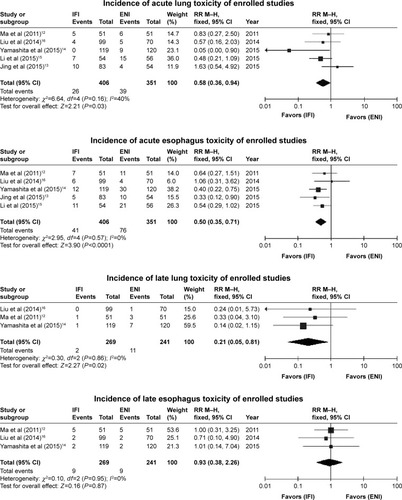
Figure 5 Forest plots comparing treatment-related toxicities for IFI and ENI.
Abbreviations: IFI, involved-field irradiation; ENI, elective nodal irradiation; RR, risk ratio; M–H, Mantel–Haenszel; CI, confidence interval.