Figures & data
Figure 1 Real-time quantitative reverse transcription polymerase chain reaction was performed to examine the expression of miR-509-5p in pancreatic cancer tissues and noncancerous adjacent tissues (n=10).
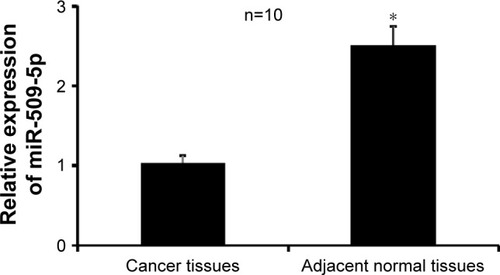
Figure 2 Inhibition of pancreatic cancer PANC-1 cell proliferation, migration, and invasion by miR-509-5p.
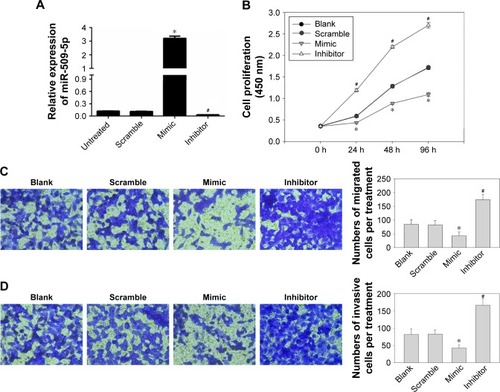
Figure 3 miR-509-5p directly targeted MDM2 to exert its effect.
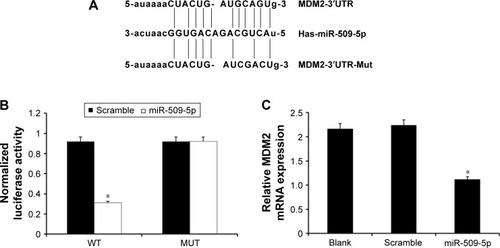
Figure 4 miR-509-5p reversed MDM2 overexpression-induced increase in pancreatic cancer PANC-1 cell proliferation and migration.
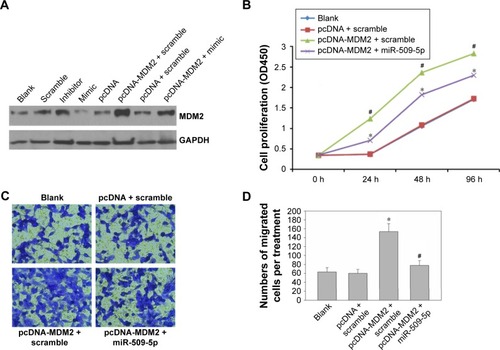
Figure 5 Inhibition of tumor growth by miR-509-5p in a xenograft mouse model.
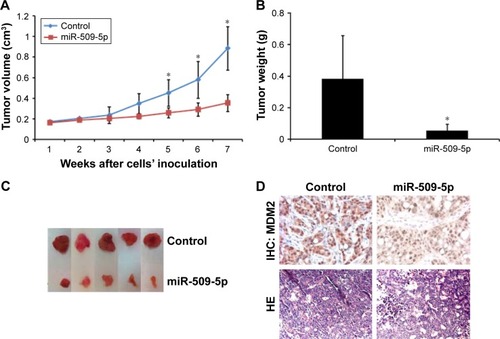
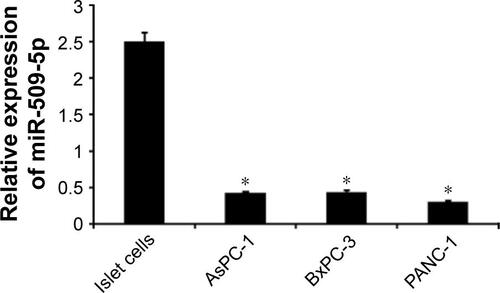
Figure S1 Real-time quantitative polymerase chain reaction was performed to examine the expression of miR-509-5p in the isolated islet cells from pancreas (n=3) and three pancreatic cancer cell lines.
Notes: Results are expressed relative to the control value. *P<0.05 vs islet cells.