Figures & data
Figure 1 Tumor section staining with hematoxylin and eosin (400×).
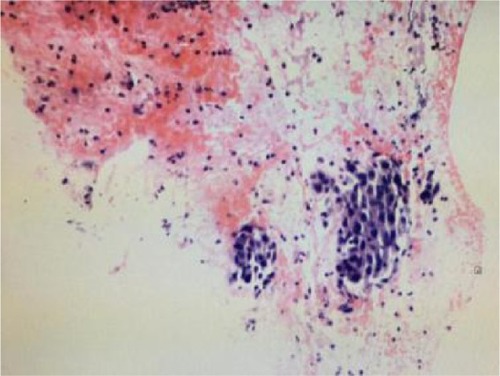
Figure 2 Thoracic computed tomography (CT) showing a mass in the left upper lobe before taking apatinib (A), an obvious cavitation in the mass (B), mass increasing after apatinib suspension for 6 days (C), cavitation extending gradually with added dose of apatinib via monthly CT examination (D and E), and an overall increase of mass despite the larger cavitation (F). The red arrows indicate specific region of tumor.
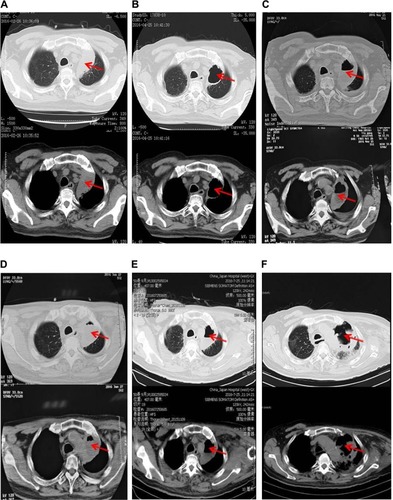
Figure 3 Cranial MRI showing the encephaledem in the occipital lobe of the head (A), encephaledem obviously alleviating (B), slightly worsening after suspension of apatinib for 6 days (C), the encephaledem basically under control as shown by CT every 2 months (D and E).
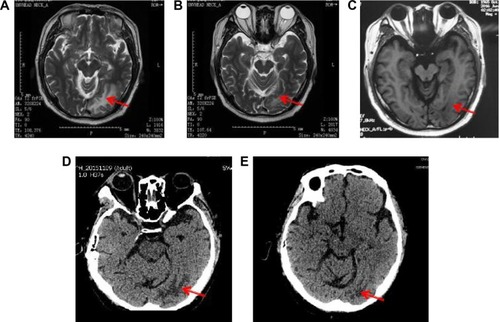
Table 1 Medication of apatinib combined with erlotinib
Figure 4 The venous blood routine from anticoagulant therapy.
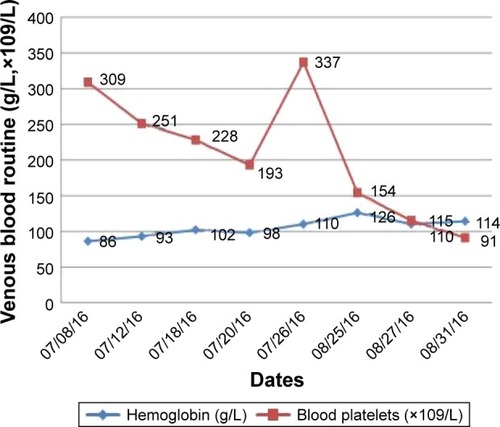
Figure 5 The activated partial thromboplastin time from anticoagulant therapy.
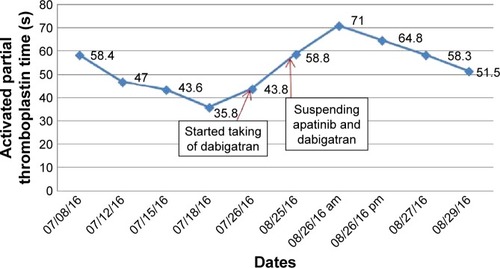
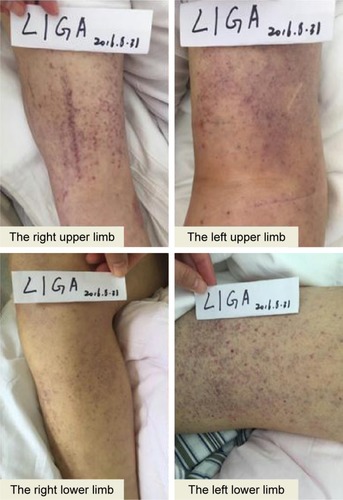
Figure 6 The subcutaneous hemorrhage in limbs on August 31, 2016.