Figures & data
Figure 1 Volcano plot of the differentially expressed genes.
Abbreviation: P-adj, adjusted P-value.
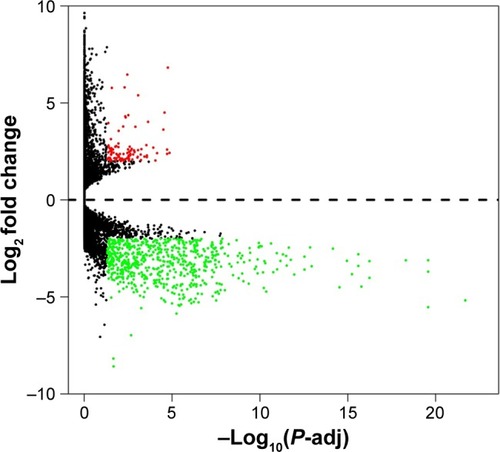
Figure 2 GSEA results of tumor and adjacent normal tissue samples.
Abbreviations: ES, enrichment score; FDR, false discovery rate; GSEA, gene set enrichment analysis.
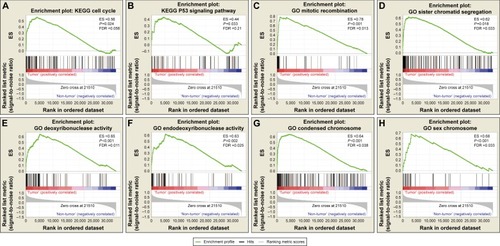
Figure 3 Heat map of the 256 prognosis-related differentially expressed genes.
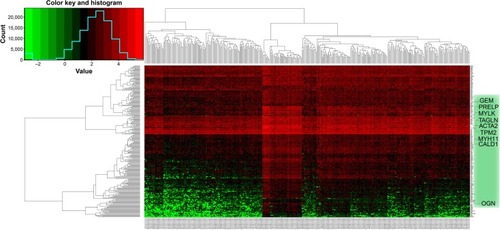
Table 1 GO term analysis of potential prognosis-DEGs associated with BUC prognosis
Table 2 KEGG analysis of potential prognosis-DEGs associated with BUC prognosis
Figure 4 GeneMANIA interaction networks.
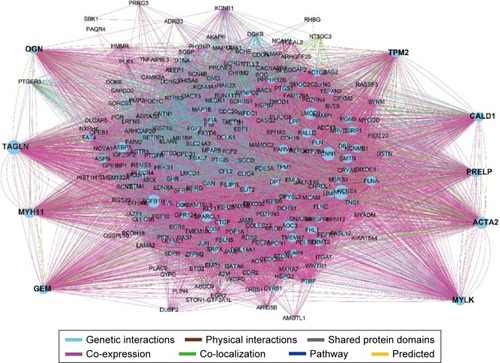
Figure 5 Protein–protein interaction networks.
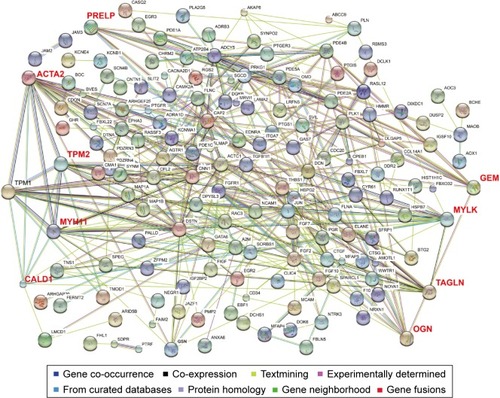
Figure 6 Top three modules from the GeneMANIA interaction networks.
Notes: A: Module 1; B: the enriched GO term and pathways of module 1; C: module 2; D: the enriched GO term and pathways of module 2; E: module 3; F: the enriched GO term and pathways of module 3.
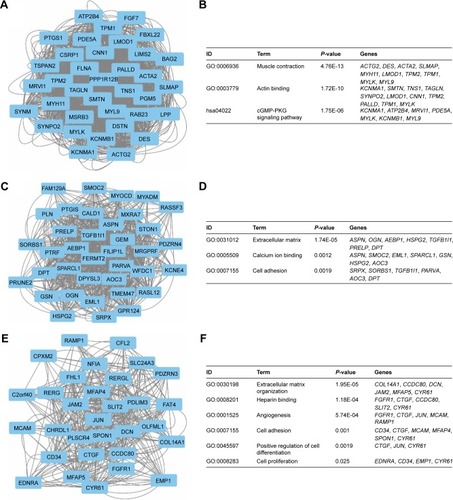
Figure 7 Top 3 modules from the PPI interaction networks.
Notes: A: module 1; B: the enriched GO term and pathways of module 1; C: module 2; D: the enriched GO term and pathways of module 2; E: module 3; F: the enriched GO term and pathways of module 3.
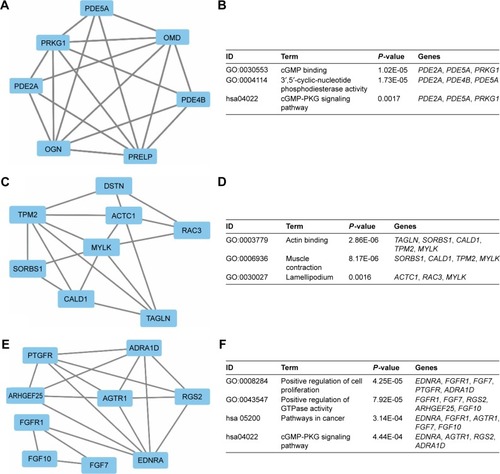
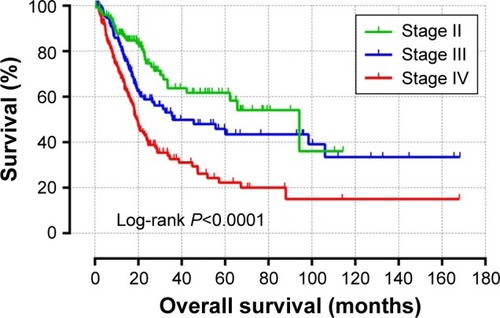
Figure 8 Kaplan–Meier survival curves for BUC patients.
Abbreviations: BUC, bladder urothelial carcinoma; OS, overall survival.