Figures & data
Table 1 The clinical characteristics of patients with GC
Figure 1 REG3A expression in GC tissues and cell lines.
Notes: (A) mRNA expression of REG3A in 41 pairs of GC and the matched normal tissues. (B) mRNA expression of REG3A in GC cell lines, including AGS, N87, SGC-7901, and BGC823. (C and D) Western blot analysis of REG3A level in GC cell lines. **P<0.01. Data are expressed as the mean ± SD (n=3).
Abbreviations: GC, gastric cancer; mRNA, messenger RNA; SD, standard deviation.
Abbreviations: GC, gastric cancer; mRNA, messenger RNA; SD, standard deviation.
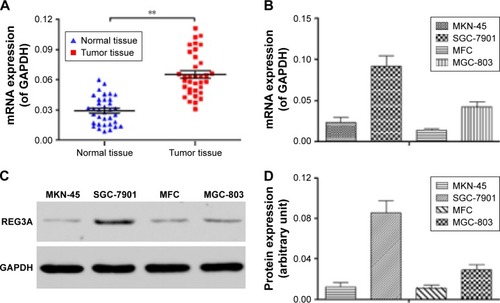
Figure 2 REG3A knockdown suppressed the proliferation of GC cells.
Notes: (A) mRNA expression of REG3A was significantly decreased in SGC-7901 cells 48 h after the transfection of REG3A siRNA. (B and C) The protein expression of REG3A was significantly decreased in SGC-7901 cells 48 h after the transfection of REG3A siRNA. (D) CCK-8 assay of the proliferation of GC cells 12, 24, 48, and 72 h after the transfection of REG3A siRNA; * and #P<0.05; ** and ##P<0.01. Data are expressed as the mean ± SD (n=6).
Abbreviations: CCK-8, Cell Counting Kit-8; GC, gastric cancer; mRNA, messenger RNA; OD, optical density; SD, standard deviation; siRNA, small interfering RNA.
Abbreviations: CCK-8, Cell Counting Kit-8; GC, gastric cancer; mRNA, messenger RNA; OD, optical density; SD, standard deviation; siRNA, small interfering RNA.
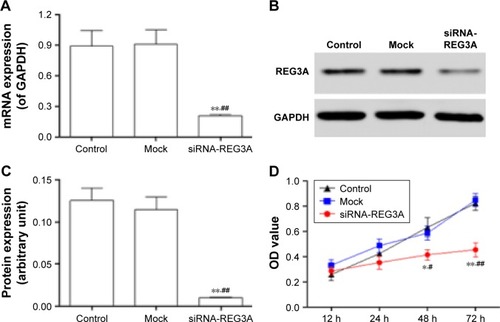
Figure 3 REG3A knockdown suppressed the migration and invasion of GC cells.
Notes: Trans-well assays of the invasion (A) and migration (B) of SGC-7901 cells 48 h after the transfection of REG3A siRNA; ** and ##P<0.01. Data are expressed as the mean ± SD (n=6).
Abbreviations: GC, gastric cancer; SD, standard deviation; siRNA, small interfering RNA.
Abbreviations: GC, gastric cancer; SD, standard deviation; siRNA, small interfering RNA.
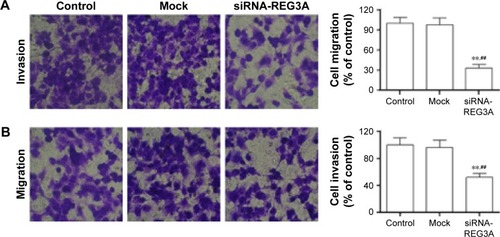
Figure 4 REG3A regulated the JAK2/STATS signal pathway in GC cells.
Notes: Western blot analysis of the phosphorylation levels of JAK2 (A) and STAT3 (B) in SGC-7901 cells 48 h after the transfection of REG3A siRNA. (C) Densitometry analysis of phosphorylated JAK2 and STAT3 levels in SGC-7901 cells; ** and ##P<0.01. Data are expressed as the mean ± SD (n=6).
Abbreviations: GC, gastric cancer; SD, standard deviation; siRNA, small interfering RNA.
Abbreviations: GC, gastric cancer; SD, standard deviation; siRNA, small interfering RNA.
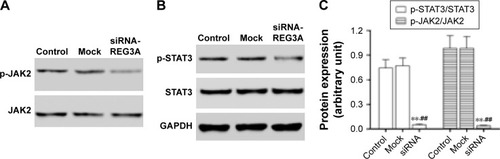
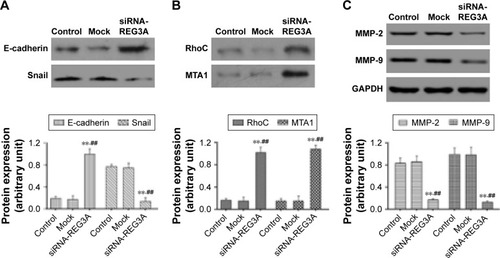
Figure 5 REG3A regulated the expression of multiple cancer-related genes.
Notes: The protein levels of E-cadherin (A), RhoC and MTA1 (B) were significantly increased, while those of Snail (A), MMP-2 and MMP-9 (C) were significantly decreased in SGC-7901 cells 48 h after the transfection of REG3A siRNA. GAPDH was loading control. ** and ##P<0.01. Data are expressed as the mean ± SD (n=6).
Abbreviation: siRNA, small interfering RNA.
Abbreviation: siRNA, small interfering RNA.