
Figures & data
Figure 1 CDR1as is highly expressed in CRC.
Notes: (A) qRT-PCR analysis of CDR1as expression in 40 paired CRC tissues and adjacent normal tissues. (B) qRT-PCR analysis of CDR1as expression in four colon cancer cell lines and two normal epithelial cell lines. (C) Kaplan–Meier curve of OS with CDR1as in CRC patients. *P<0.05, **P<0.01, and ***P<0.001.
Abbreviations: CRC, colorectal cancer; qRT-PCR, quantitative reverse transcription polymerase chain reaction; OS, overall survival; HR, hazard ratio; CI, confidence interval.
Abbreviations: CRC, colorectal cancer; qRT-PCR, quantitative reverse transcription polymerase chain reaction; OS, overall survival; HR, hazard ratio; CI, confidence interval.
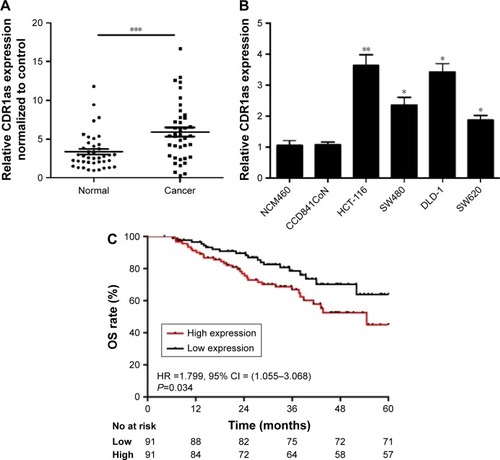
Table 1 Correlations between CDRlas expression and clinico-pathological parameters in CRC
Figure 2 CDR1as downregulation inhibits tumor cell proliferation.
Notes: (A) qRT-PCR analysis of CDR1as expression and cell viability analysis in shCON and shCDR1as lentivirus-infected HCT-116 and DLD-1 cells. (B) Cell-cycle distributions of HCT-116 and DLD-1 cells infected with shCON or shCDR1as lentivirus for 72 h. (C) CDR1as knockdown did not significantly increase apoptosis rate in colon cancer HCT-116 cells. (D) Colony images and counts of shCON and shCDR1as lentivirus-infected HCT-116 and DLD-1 cells. *P<0.05, **P<0.01 and ***P<0.001.
Abbreviations: qRT-PCR, quantitative reverse transcription polymerase chain reaction; shCON, control-scrambled shRNA; shCDR1as, shRNA targeting CDR1as; OD, optical density.
Abbreviations: qRT-PCR, quantitative reverse transcription polymerase chain reaction; shCON, control-scrambled shRNA; shCDR1as, shRNA targeting CDR1as; OD, optical density.
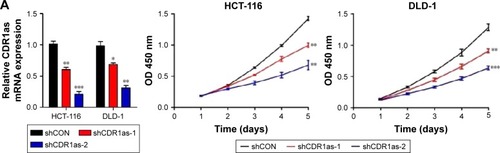
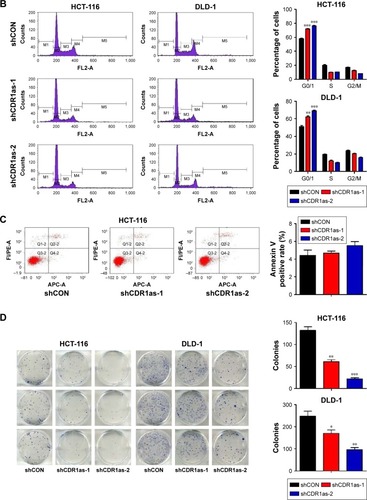
Figure 3 CDR1as downregulation suppresses tumor cell invasion.
Notes: (A) Invasion images and counts of colon cancer cells infected with control or shCDR1as lentivirus for 72 h (magnification 100×). (B) Western blot analysis of MMP-9 in HCT-116 and DLD-1 cells infected with control or shCDR1as lentivirus for 72 h. **P<0.01 and ***P<0.001.
Abbreviations: shCON, control-scrambled shRNA; shCDR1as, shRNA targeting CDR1as.
Abbreviations: shCON, control-scrambled shRNA; shCDR1as, shRNA targeting CDR1as.
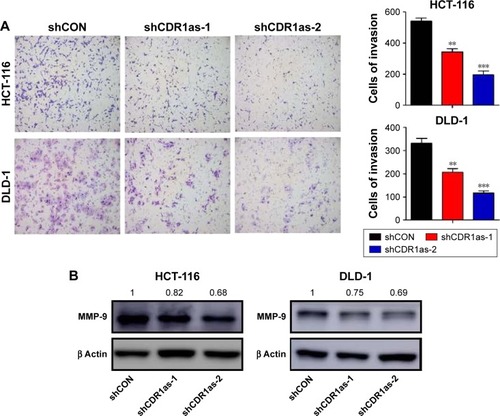
Figure 4 CDR1as promotes cell growth and invasion through partially blocking miR-7.
Notes: (A) qRT-PCR analysis of miR-7 expression in shCON and shCDR1as lentivirus-infected HCT-116 and DLD-1 cells for 72 h. (B) Growth curves of miRNA-Ctrl and miR-7 mimics in HCT-116 and DLD-1 cells for 5 days. (C) Cell-cycle distributions of HCT-116 and DLD-1 cells transfected with miRNA-Ctrl or miR-7 mimics for 48 h. (D) miR-7 mimics did not significantly increase apoptosis rate in colon cancer HCT-116 cells. (E) Growth curves of shCON, shCDR1as, and shCDR1as plus the miR-7 inhibitor in HCT-116 and DLD-1 cells. (F) Invasion images and counts of HCT-116 and DLD-1 cells treated by shCON, shCDR1as, and shCDR1as plus the miR-7 inhibitor. *P<0.05 and **P<0.01.
Abbreviations: miR-7, microRNA-7; qRT-PCR, quantitative reverse transcription polymerase chain reaction; shCON, control-scrambled shRNA; shCDR1as, shRNA targeting CDR1as; miRNA, microRNA; Ctrl, control; OD, optical density.
Abbreviations: miR-7, microRNA-7; qRT-PCR, quantitative reverse transcription polymerase chain reaction; shCON, control-scrambled shRNA; shCDR1as, shRNA targeting CDR1as; miRNA, microRNA; Ctrl, control; OD, optical density.
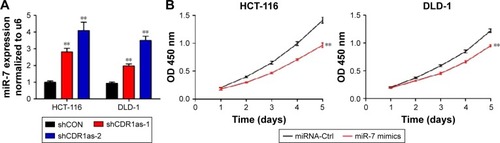
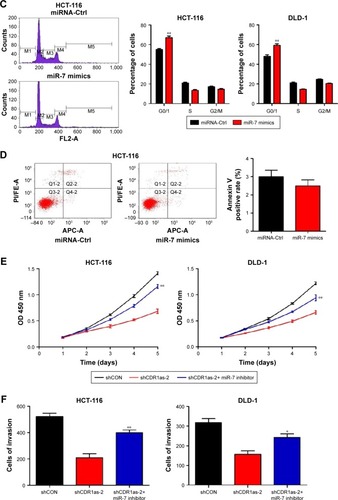
Figure 5 CDR1as positively regulates EGFR and IGF-1R in CRC.
Notes: (A) qRT-PCR analysis of miR-7-targeted genes in HCT-116 cells infected with shCON and shCDR1as lentivirus for 72 h. (B) Western blot analysis of EGFR and IGF-1R following shCON and shCDR1as lentivirus infection for 72 h in HCT-116 cells. (C) Western blot analysis of EGFR and IGF-1R in HCT-116 cells treated by shCON, shCDR1as, and shCDR1as plus the miR-7 inhibitor for 72 h. (D) EGFR and IGF-1R mRNA levels were positively correlated with CDR1as expression in CRC tumor samples. **P<0.01.
Abbreviations: CRC, colorectal cancer; qRT-PCR, quantitative reverse transcription polymerase chain reaction; miR-7, microRNA-7; shCON, control-scrambled shRNA; shCDR1as, shRNA targeting CDR1as.
Abbreviations: CRC, colorectal cancer; qRT-PCR, quantitative reverse transcription polymerase chain reaction; miR-7, microRNA-7; shCON, control-scrambled shRNA; shCDR1as, shRNA targeting CDR1as.
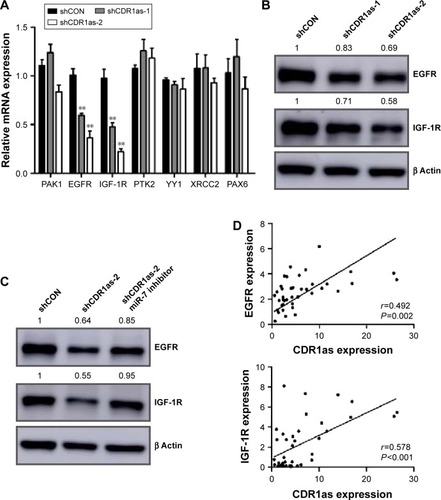
Figure S1 CDRlas expression is not correlated with miR-7.\
Note: Pearson correlation analysis of CDRlas and miR-7 expression in 182 CRC tumor samples.
Abbreviations: miR-7, microRNA-7; CRC, colorectal cancer.
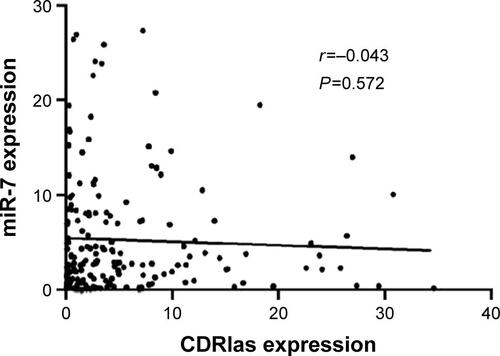
Table S1 Specific real-time qPCR primers
Table S2 Correlations between miR-7 expression and clinicopathological parameters in CRC