Figures & data
Figure 1 RNA degradation plots for all samples.
Abbreviation: DDLPS, dedifferentiated liposarcoma.
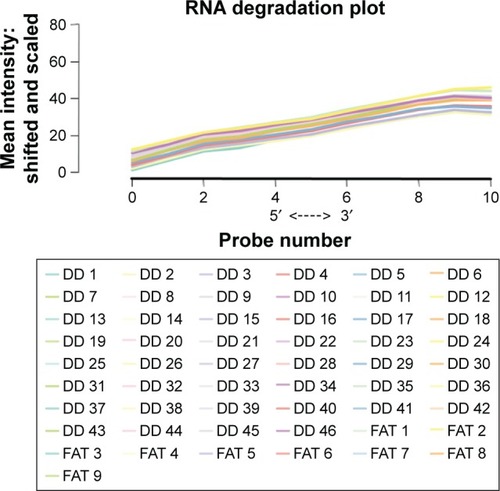
Figure 2 Differential gene expression pattern between DDLPS and the normal fat control.
Abbreviations: DDLPS, dedifferentiated liposarcoma; PCA, principal component analysis; DEGs, differentially expressed genes.
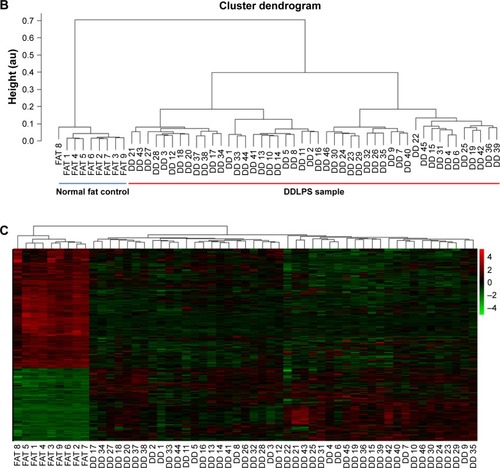
Table 1 Enriched GO terms and KEGG pathways for the identified DEGs
Figure 3 PPI network for DEGs.
Abbreviations: PPI, protein–protein interaction; DEGs, differentially expressed genes.
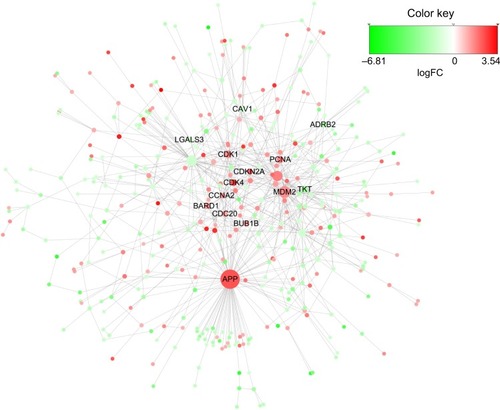
Table 2 Identified hub genes in the PPI network
Figure S1 The actin and GAPDH 3′/5′ ratio tests for all samples (46 DDLPS; nine normal fat controls).
Note: These results confirmed that all the actin and GAPDH 3′/5′ ratios of included microarray raw profiles were <3 and that no bioB alert was found. DD=DDLPS; FAT=normal fat control.
Abbreviations: DDLPS, dedifferentiated liposarcoma; QC, quality control.
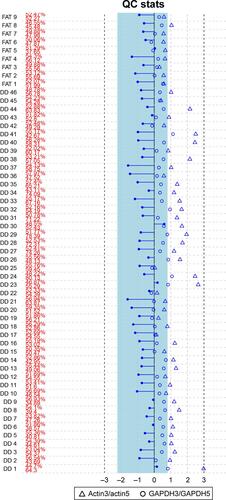
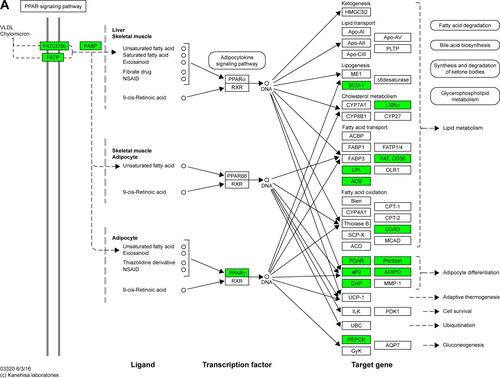
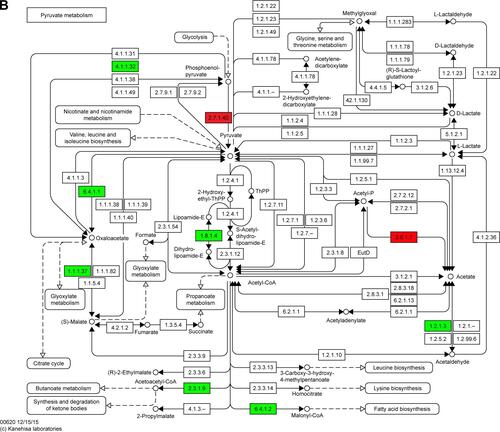
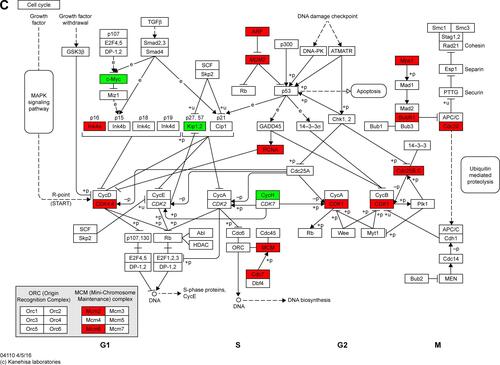
Figure S2 Maps of the three identified KEGG pathways.
Notes: (A) PPAR signaling pathway; (B) pyruvate metabolism pathway; and (C) cell cycle pathway. In the maps, red chips represent up-regulated DEGs, while green chips represent down-regulated DEGs. Copyright © Kanehisa Laboratories. Reproduced with permission.Citation1
Abbreviations: KEGG, Kyoto Encyclopedia of Genes and Genomes; DEGs, differentially expressed genes.