
Figures & data
Figure 1 Representative images of high-expression and low-expression EVI1 detected with IHC.
Notes: (A) Representative image of low-expression EVI1 detected with IHC. EVI1 was mainly observed in the nucleus and, in some cells, it was expressed in cytoplasm. Scale bar: 50 μm. (B) Representative image of high-expression EVI1 detected with IHC. Scale bar: 50 μm.
Abbreviations: EVI1, ecotropic viral integration site-1; IHC, immunohistochemistry.
Abbreviations: EVI1, ecotropic viral integration site-1; IHC, immunohistochemistry.
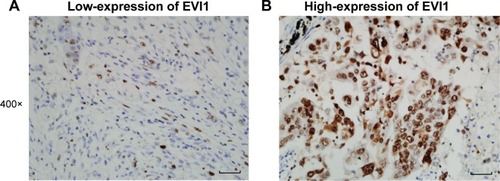
Table 1 Characteristics of patients with SCC
Table 2 Correlation between EVI1 expression and the clinicopathological parameters
Figure 2 Overall survival curves of the lymphatic status, pTNM stage, and EVI1 expression.
Notes: Overall survival curves of (A) positive and negative lymphatic invasion, (B) different pTNM stages, and (C) high- and low-expression EVI1 were analyzed by the Kaplan–Meier method, and the statistical difference was analyzed by the log-rank test.
Abbreviations: EVI1, ecotropic viral integration site-1; pTNM, pathological tumor-node-metastasis.
Abbreviations: EVI1, ecotropic viral integration site-1; pTNM, pathological tumor-node-metastasis.
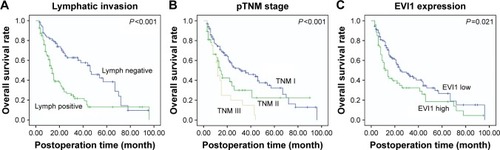
Table 3 Prognostic significance of EVI1 in SCC