
Figures & data
Table 1 Primer sequences used for qPCR analyses
Figure 1 A and B: HMGCS2 was downregulated in ESCC tumor tissues. HMGCS2 was markedly decreased in tumor tissues when compared with paired adjacent non-tumor tissues. ***P<0.0001, paired t-test.
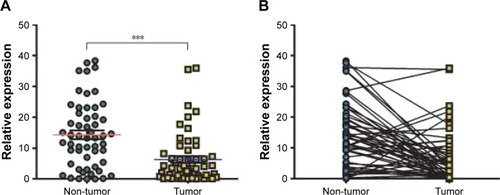
Figure 2 Representative of HMGCS2 expression in adjacent non-tumor tissue (upper) and ESCC tumor tissue (bottom) detected by immunostaining with anti-HMGCS2 antibody (brown). The slide was counterstained was hematoxylin (original magnification: left ×100, right ×200).
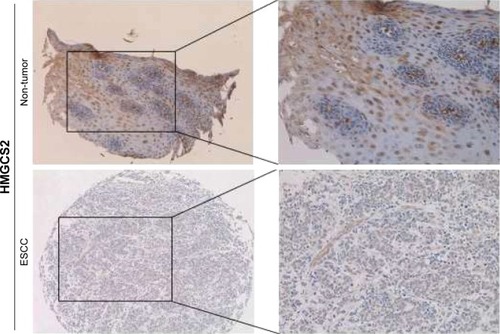
Table 2 Correlation between HMGCS2 expression and clinicopathological features of primary ESCC
Figure 3 Survival curves plotted by employing Kaplan–Meier estimator. A and B: Kaplan–Meier plot with univariate analysis indicated that patients with low HMGCS2 expression had a poorer OS (P=0.002) and RFS (P=0.007) than those with normal HMGCS2 expression through a log-rank test. C and D: A stratified survival analysis according to the pathological stage revealed that HMGCS2 expression discernibility on RFS was only pronounced in patients with advanced clinical stage (pStage III). P=0.001, log-rank test.
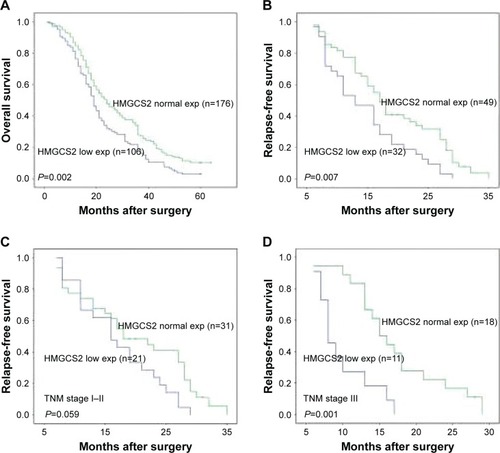
Table 3 Uninvariate Cox regression analysis for OS and RFS in ESCC
Table 4 Muitivariate Cox regression analysis for OS and RFS in ESCC