
Figures & data
Table 1 Characteristics of CRC patients treated with surgical resection according to PLR
Figure 1 The graded relationship between increasing number of MetS components and PLR.
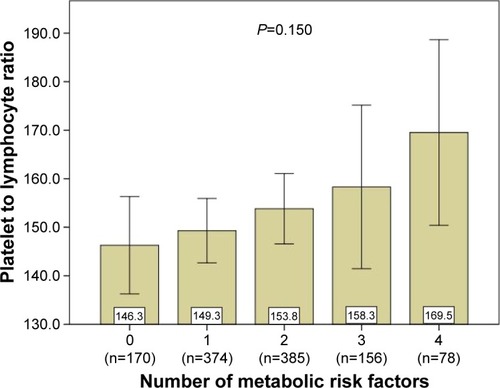
Table 2 Baseline characteristics of CRC patients stratified by MetS
Figure 2 Kaplan–Meier survival curves showing overall survival (A) and disease-free survival (B) stratified by PLR in CRC patients (cutoff values 120, 220, respectively).
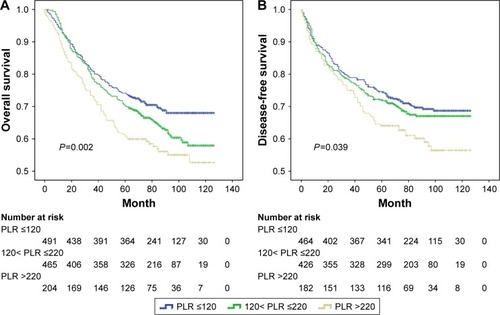
Figure 3 Kaplan–Meier survival curves showing overall survival (A) and disease-free survival (B) stratified by MetS in CRC patients.
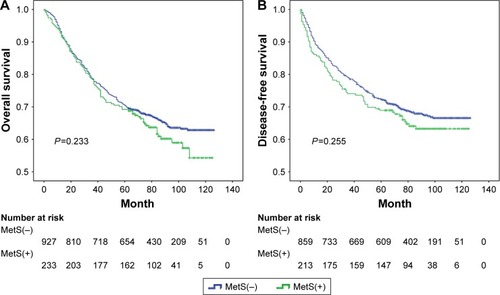
Table 3 Cox proportional hazard regression models of risk factors associated with prognosis among CRC patients
Figure 4 Kaplan–Meier survival curves showing overall survival stratified by PLR in CRC patients with MetS (A) and overall survival stratified by MetS in CRC patients with PLR >220 (B).
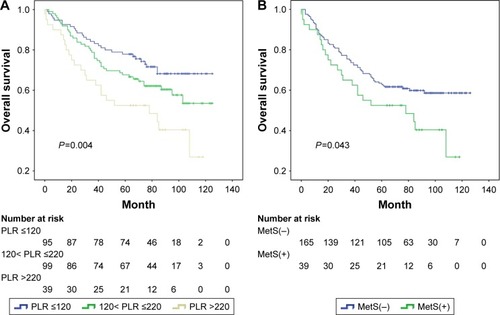
Table 4 Cox proportional hazard regression analysis of prognosis stratified by MetS
Table 5 Cox proportional hazard regression analysis of the prognosis of the subgroups of PLR