Figures & data
Table 1 Relative intensity of fluorescence signals between UM-1, CAL-27, TCA-8113 and squamous cells
Table 2 Expression of IP-l0, MIP-1β, and MIP-3α detected by ELISA
Figure 1 High expression of MIP-3α in the cytoplasm and nucleus of TSCC.
Abbreviations: MIP, macrophage inflammatory protein; TSCC, tongue squamous cell carcinoma.
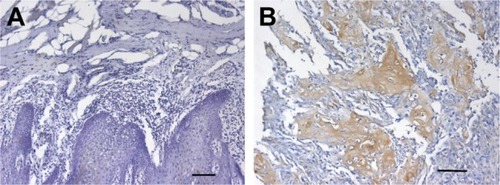
Table 3 Expression of MIP-3α in the TSCC and squamous cells
Table 4 Expression of MIP-3α in the TSCC cells was correlated with the lymph node metastasis and the clinical stages (P<0.05), but not with the pathologic grade of the tongue cancer
Figure 2 Expression of CCR5, CCR6, and CXCR3 in three human tongue squamous cell carcinoma cell lines (CAL-27, UM-1, and TCA-8113) by Western blot.
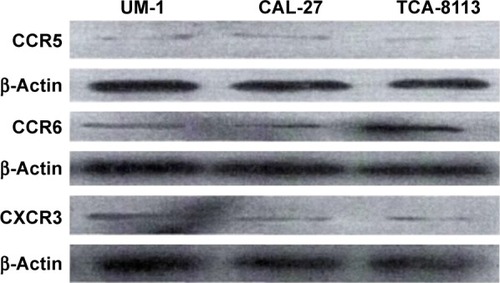
Figure 3 Expression of CCR5, CCR6, and CXCR3 in both cell membrane and cytoplasm of CAL-27, UM-1 and TCA-8113 by immunofluorescence staining.
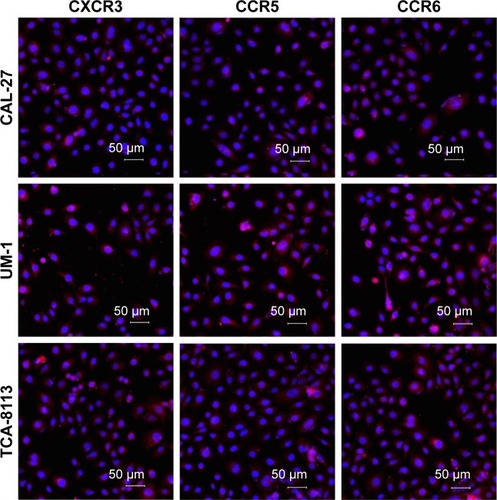
Figure 4 Viability assays show the proliferation of CAL-27 cells by IP-10 (A), MIP-3α (B), and MIP-1β (C).
Abbreviations: IP-10, interferon gamma-induced protein 10; MIP-1β, macrophage inflammatory protein-1β; MIP-3α, macrophage inflammatory protein-3α.
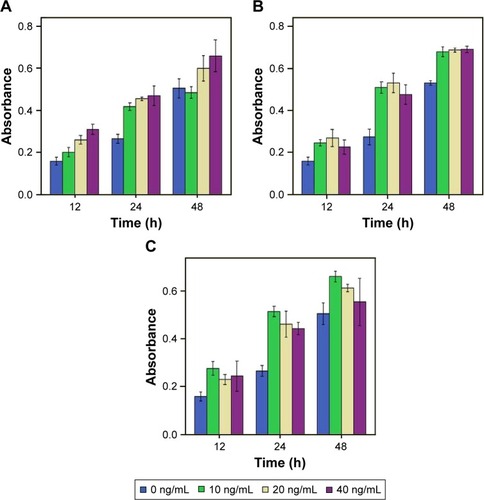
Figure 5 Apoptosis in CAL-27 cells induced by MIP-1β.
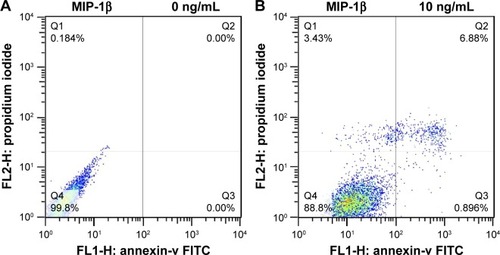
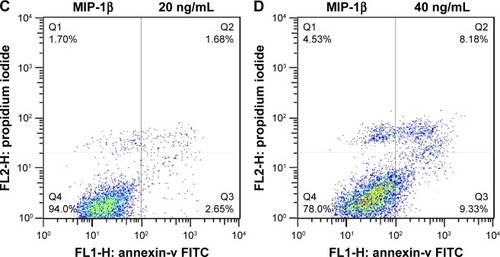
Figure 6 Apoptosis in Cal-27 cells induced by IP-10.
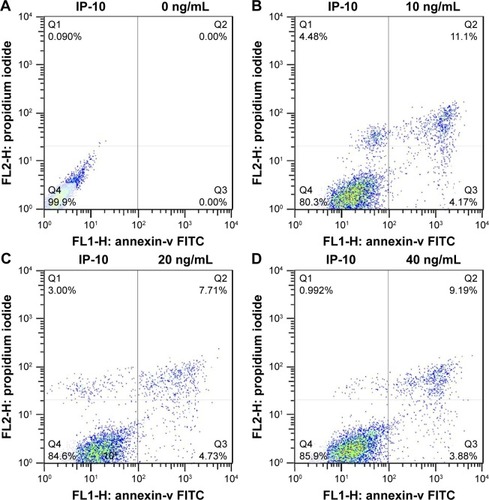
Figure 7 Invasive capability of TSCC cells by Transwell invasion assay.
Abbreviations: IP-10, interferon gamma-induced protein 10; MIP, macrophage inflammatory protein; TSCC, tongue squamous cell carcinoma.

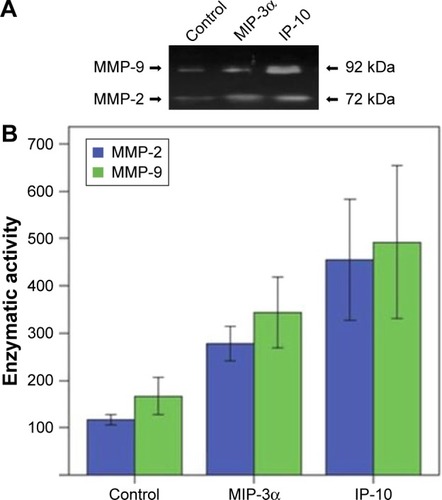
Figure 8 MMP-2 and MMP-9 activities were significantly increased in the MIP-3α-and IP-10-treated cells.
Abbreviations: IP-10, interferon gamma-induced protein 10; MIP-1β, macrophage inflammatory protein-1β; MIP-3α, macrophage inflammatory protein-3α; MMP, matrix metalloproteinase; TSCC, tongue squamous cell carcinoma.