Figures & data
Figure 1 Flowchart of the literature search procedure.
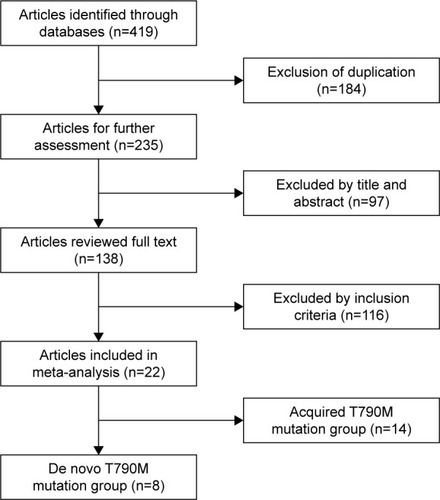
Table 1 Studies of pretreatment T790M mutation
Table 2 Studies of posttreatment-acquired T790M mutation
Table 3 Quality assessment of studies included in the pretreatment T790M mutation group
Table 4 Quality assessment of studies included in the posttreatment-acquired T790M mutation group
Table 5 Summary of heterogeneity and publication bias in all studies included in the meta-analysis
Figure 2 Forest plots of pooled HRs and 95% CIs for PFStotal (A) and OStotal (B) according to pretreatment de novo T790M mutation status.
Abbreviations: CI, confidence interval; HR, hazard ratio; OStotal, overall survival for all lines of epidermal growth factor-tyrosine kinase inhibitor treatment; PFStotal, progression-free survival for all lines of epidermal growth factor-tyrosine kinase inhibitor treatment.
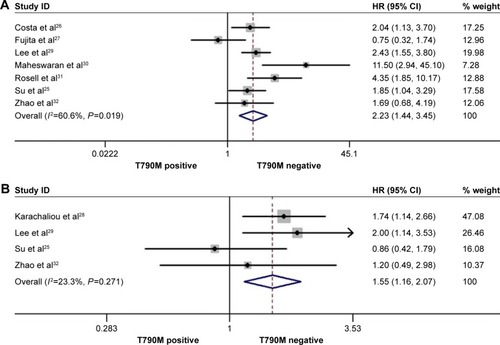
Figure 3 Forest plots of pooled HRs for all PFSfirst-line (A) and RRs for ORRtotal (B) according to pretreatment de novo T790M mutation status.
Abbreviations: CI, confidence interval; HRs, hazard ratios; PFSfirst-line, progression-free survival for first-line of epidermal growth factor-tyrosine kinase inhibitor treatment; ORRtotal, objective response rate for all lines of epidermal growth factor-tyrosine kinase inhibitor treatment; RR, relative ratio.
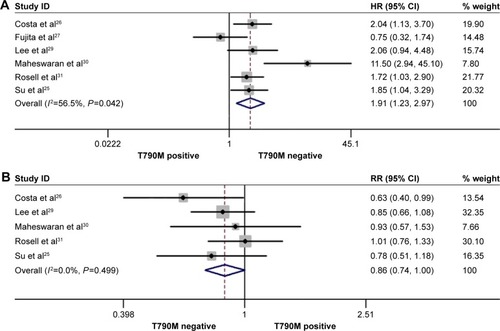
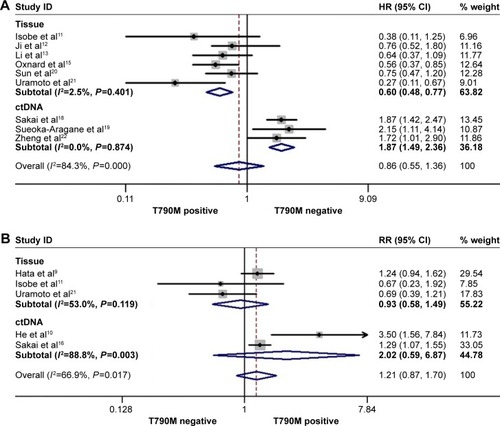
Figure 4 Forest plots of HRs and 95% CIs for PFS (A) and PPS (B) according to acquired T790M mutation status.
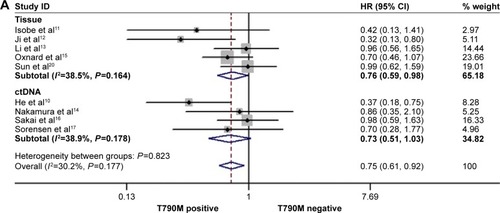
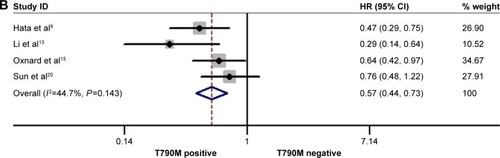
Figure 5 Forest plots of HRs for OS (A) and RR for ORR (B) according to acquired T790M mutation status.
Abbreviations: CI, confidence interval; ctDNA, circulating tumor DNA; HRs, hazard ratios; ORR, objective response rate; OS, overall survival; RR, relative ratio.