
Figures & data
Figure 1 (A) Internal control gene in HEX channel. (B) KRAS gene Wild-type in FAM channel. (C) KRAS gene mutant-type in FAM channel. (D) KRAS gene double mutant-type in FAM channel.
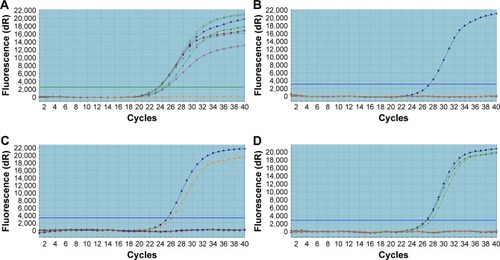
Figure 2 KRAS gene single mutation rate of codons 12 and 13 in primary and metastatic CRC.
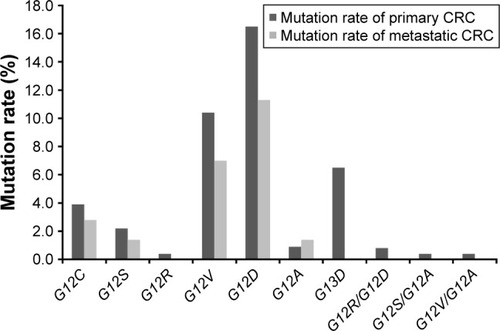
Table 1 KRAS gene mutation location in primary tumors and metastases
Table 2 Analysis of the clinical and pathological characteristics of patients with primary tumors, and comparison of patients having only a primary lesion with those having paired metastatic lesions and association between CRC and codons 12 and 13
Table 3 The relationship between gene status and the clinical and pathological features of CRC metastases stratified by KRAS status
Table 4 Comparison of KRAS gene status between primary CRC tumors and metastases of CRC
Figure 3 The Kaplan-Meier survival curve for patients with the KRAS gene.
Abbreviations: che, chemotherapy; cet, cetuximab; Mut, mutation; WT, wild-type.
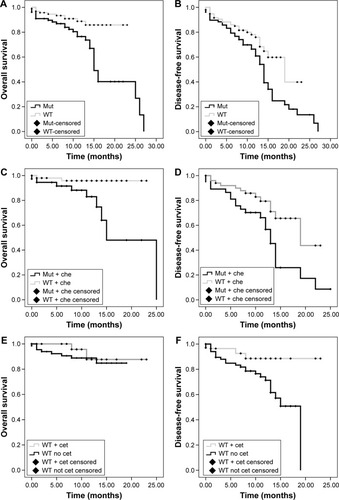
Table 5 Univariate prognostic analysis of OS and DFS
Table 6 Logistic regression models to find out predictors of OS and DFS