
Figures & data
Table 1 Demographic and clinical profiles of the three patient cohorts
Table 2 Distribution and median OS of exon 20-mutated patients
Figure 1 Graph of survival in different types of exon 20-mutated patients.
Abbreviations: OS, overall survival; EGFR, epidermal growth factor receptor.
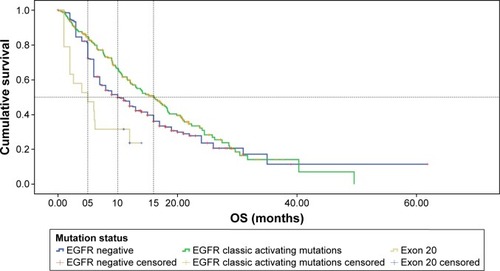
Figure 2 Graph of OS in all three cohorts.
Abbreviation: OS, overall survival.
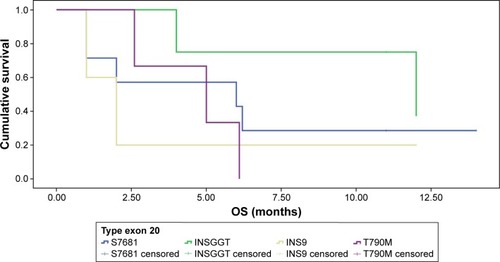
Table 3 Multivariate analysis results for OS