
Figures & data
Table 1 Characteristics of the study population and comparison (n=421)
Table 2 Clinical characteristics of 13 patients with EGFR and ALK/ROS1 concurrent genes
Table 3 Clinical efficacy comparison of EGFR-TKI in single EGFR mutation and concurrent gene alterations
Figure 1 Comparison of PFS between single EGFR and concomitant ALK/ROS1 gene mutants on EGFR-TKI (10.7 vs 6.6 months, P=0.004).
Abbreviations: PFS, progression-free survival; TKI, tyrosine kinase inhibitor.
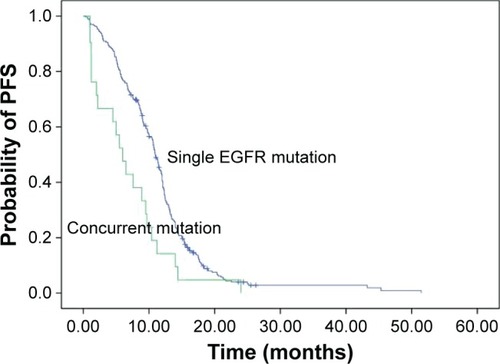
Figure 2 Comparison of OS between single EGFR and concomitant ALK/ROS1 gene mutants on EGFR-TKIs (21.0 vs 23.0 months, P=0.196).
Abbreviations: OS, overall survival; TKI, tyrosine kinase inhibitor.
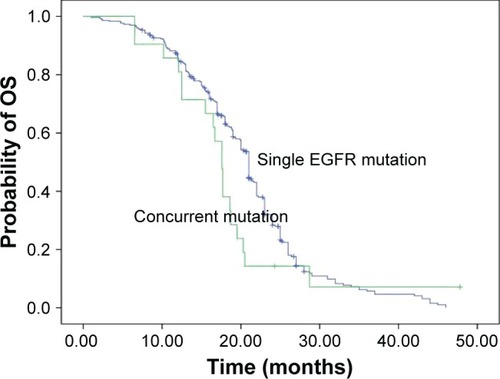
Table S1 The subtypes of EGFR/ALK/ROS1 genes