Figures & data
Figure 1 Formation steps of MCTS by the cyclo-RGDfK(TPP) peptide-based biochemical method. Step 1: formation of loose cell aggregates via α5β1 integrin – cyclo-RGDfK(TPP) peptide binding; step 2: a delay period for E-cadherin expression and accumulation; step 3: formation of compact MCTS through E-cadherin–E-cadherin interactions.
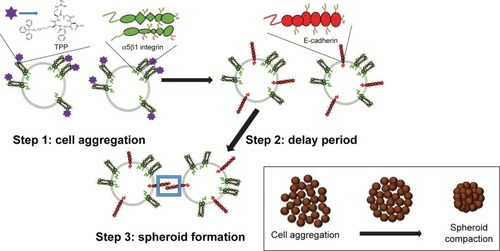
Figure 2 Prostaspheres of (A) DU145 and (B) DU145GemR cells by the classical agarose and cyclo-RGDfK(TPP) peptide methods in a time-dependent manner. The images were taken with a digital camera mounted on a phase-contrast inverse light microscope at 10× magnification. A total of 10,000 cells/well were plated on 1.5% weight of agarose-coated 96-well plates for 7 days in the classical agarose method. For the cyclo-RGDfK(TPP) peptide method, 10,000 cells were added to each well in a 96-well plate. Cyclo-RGDfK(TPP) peptide was added at a concentration of 50 μM for both DU145 and DU145GemR cells (A and B).
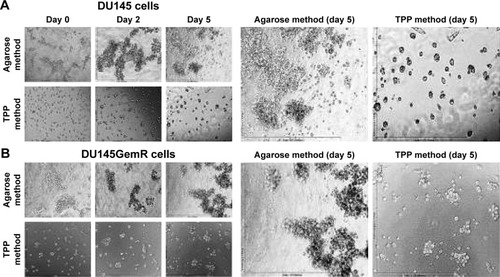
Figure 3 Cyclo-RGDfK(TPP) method of MCTS formation using (A) DU145 cells, (B) DU145GemR cells, (C) PC3 cells, and (D) PC3GemR cells. A total of 10,000 cells were plated per well in a 96-well plate. Cyclo-RGDfK(TPP) peptide was added in a range of concentrations from 12.5 to 100 μM. The control group was the monolayer cells with no cyclo-RGDfK(TPP) peptide added. The images were taken with a digital camera mounted on a phase-contrast inverse light microscope at 10× objective on day 6.
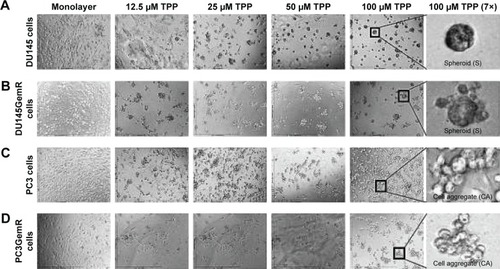
Figure 4 Immunocytochemistry (A) to determine the expression of E- and N-cadherin on the cell surface of nonpermeabilized DU145GemR, PC3, and PC3GemR cells. (A) DU145GemR, PC3, and PC3GemR cells were fixed with 4% PFA, stained with primary antibodies against E- and N-cadherin followed by secondary polyclonal goat anti-rabbit IgG conjugated with DyLight 594. The background controls are stained only with the secondary antibody. Images were taken with an epifluorescent microscope using a 20× objective. The bars represent 100 μm. Images are representative of three fields of view from two independent experiments. (B) Quantitative analysis was done by assessing the density of cell staining corrected for background for 5–6 separate image panels using Corel Photo Paint 8.0 software. Each bar in the graphs represents the mean fluorescence corrected density of staining ± standard error (error bars) for all cells within the respective images. Results were compared by a one-way ANOVA at 95% confidence interval using Fisher’s LSD test. (C) DU145GemR, PC3, and PC3GemR cells were stained with primary antibodies against E- and N-cadherin for 1 hour on ice followed by secondary polyclonal goat anti-rabbit IgG conjugated with DyLight 488. Control cells were stained with only secondary polyclonal goat anti-rabbit IgG conjugated with DyLight 488. Cells were analyzed by Beckman Coulter Cytomics FC500 flow cytometry and CxP software. Overlay histograms display the median fluorescence for each histogram for 5×10⁵ acquired cells (100% gated). The data are a representation of one of two experiments showing similar results.
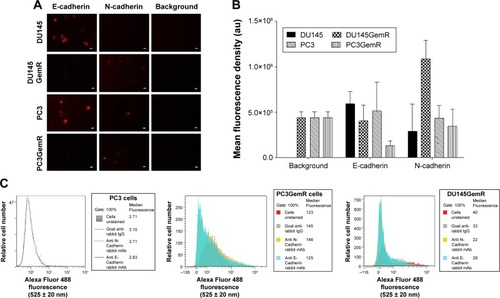
Figure 5 Immunocytochemistry and flow cytometry to determine the expression of α2,3- and α2,6-linked SA on the cell surface of nonpermeabilized PC3 and PC3GemR cells. (A and C) PC3 and PC3GemR were fixed with 4% PFA followed by staining with biotinylated lectins, MAL-2 specific for α2,3-SA and SNA specific for α2,6-SA. Stained cells were then treated with DyLight 594 streptavidin. The background controls are cells with only DyLight 594 streptavidin staining. Images were taken with an epifluorescence microscope using a 20× objective. The bars represent 100 μm. Images are representative of three fields of view from three separate experiments. (B and D) Quantitative analysis was done by assessing the density of cell staining corrected for background for 5–6 separate image panels using Corel Photo Paint 8.0 software. Each bar in the graphs represents the mean fluorescence corrected density of staining ± standard error (error bars) for all cells within the respective images. Results were compared by a one-way ANOVA at 90% confidence interval using Fisher’s LSD test. (E and F) PC3 and PC3GemR cells were stained with biotinylated lectins for 1 hour on ice followed with streptavidin conjugated DyLight 488 and fixed. Control cells were stained with only DyLight488 conjugated streptavidin. Cells were analyzed by Beckman Coulter Cytomics FC500 flow cytometry and CxP software. Overlay histograms are displayed. Gray filled histogram represents unstained cells; black-dashed unfilled histogram depicts DyLight 488-conjugated streptavidin-treated cells; dotted black line unfilled histogram for biotinylated SNA-stained cells plus DyLight 488 conjugated streptavidin; black line unfilled histogram represents biotinylated MAL-II-stained cells plus DyLight 488-conjugated streptavidin. The median fluorescence for each histogram is for 500,000 acquired cells (100% gated). The data are a representation of one of two experiments showing similar results. (G) Graph of normalized ratio of α2,3-SA/α2,6-SA to control cells from flow cytometry analyses is displayed. Results were compared by unpaired t-test at 95% confidence interval.
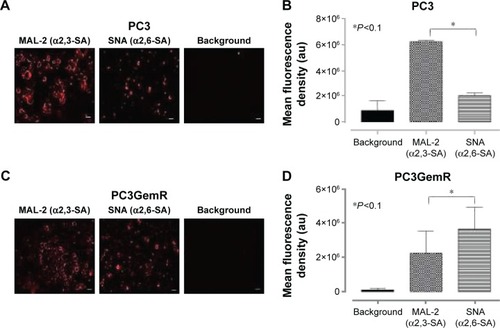
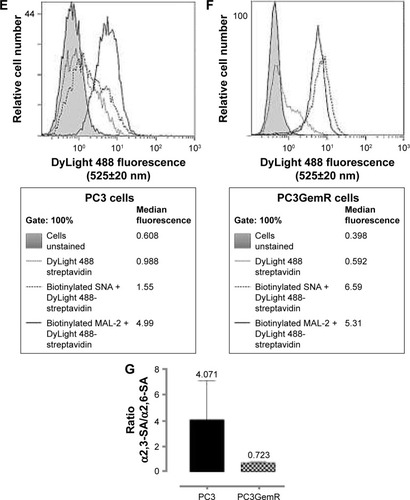
Figure 6 Immunocytochemistry (A and C) and flow cytometry (E and F) to determine the expression of α2,3- and α2,6-linked SA on the cell surface of nonpermeabilized DU145 and DU145GemR cells. Images are representative of three fields of view in three separate experiments. (B and D) Quantitative analysis was done by assessing the density of cell staining corrected for background for 5–6 separate image panels by using Corel Photo Paint 8.0 software. Each bar in the graphs represents the mean fluorescence corrected density of staining ± standard error (error bars) for all cells within the respective images. Results were compared by a one-way ANOVA at 90% confidence interval using Fisher’s LSD test. (E and F) Overlay histograms are displayed. Red histogram represents unstained cells; grey histogram depicts DyLight 488-conjugated streptavidin treated cells; yellow histogram for biotinylated SNA-stained cells plus DyLight 488-conjugated streptavidin; blue histogram represents biotinylated MAL-2-stained cells plus DyLight 488-conjugated streptavidin. The median fluorescence for each histogram is for 5×10⁵ acquired cells (100% gated). The data are a representation of one of two experiments showing similar results. (G) Graph of normalized ratio of α2,3-SA/α2,6-SA to control cells from flow cytometry analyses is displayed. Results were compared by unpaired t-test at 95% confidence interval.
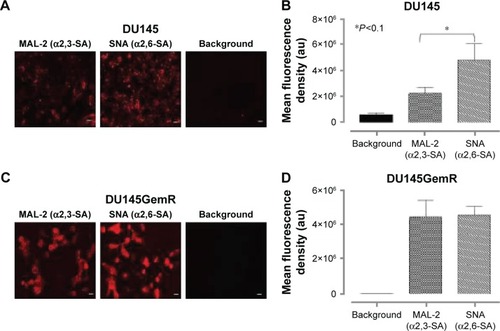
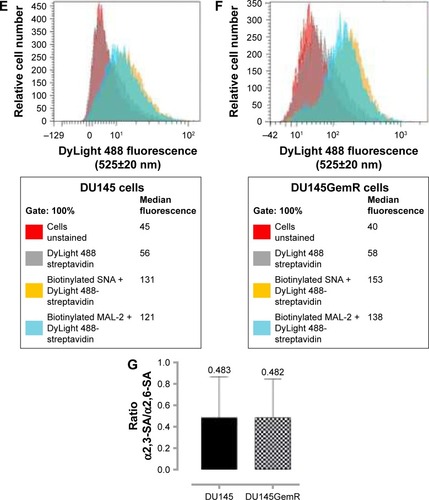
Figure 7 Quantitative analysis of the density of cell staining corrected for background for 5–6 separate image panels by using Corel Photo Paint 8.0 software. Each bar in the graph represents the total SA mean fluorescence corrected background density of staining ± standard error (error bars) for all cells within the respective images.
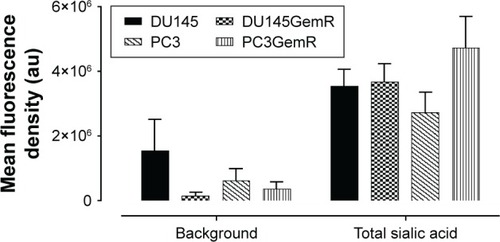
Figure 8 (A) Sialidase activity in live parental DU145, PC3, and resistant DU145GemR and PC3GemR cells. Cells were allowed to adhere on 12 mm circular glass slides in media containing 10% fetal calf serum for 24 hours. After removing media, 0.318 mM 4-MUNANA substrate (2′(4-methlyumbelliferyl)-α-N-acetylneuraminic acid) in Tris-buffered saline pH 7.4 was added to live cells alone (control) or with EGF at 100 μg/mL. The substrate is hydrolyzed by sialidase to give free 4-methylumbelliferone, which has a fluorescence emission at 450 nm (blue color) following excitation at 365 nm. Fluorescent images were taken at 2 minutes after adding substrate by using epifluorescent microscopy (10× objective). (B) The mean fluorescence of 50 multipoint replicates was quantified by using the ImageJ software. Results were compared by one-way ANOVA at 95% confidence interval by using Bonferroni test. Data are a representation of one of two independent experiments showing similar results.
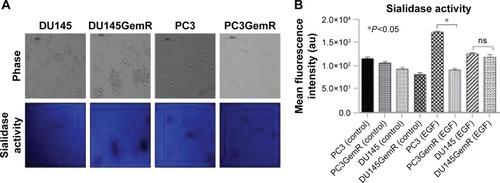
Figure 9 (A) Phase-contrast images of DU145, DU145GemR, and PC3GemR at 10× objective treated with a combination of 50 μM cyclo-RGDfK(TPP) peptide and OP or without OP at concentrations of 50, 100, or 200 μg/mL for 6 days. A total of 10,000 cells were plated per well in a 96-well plate for 6 days. (B) MCTS volume was measured by using V = (4/3) πrCitation3 where π = 3.1415 and r = average radius (microns). Radius was measured from the scale bar. Each bar in the graph represents mean MCTS volume ± standard error (error bars) for all MCTS within the representative images. Results were compared by a one-way ANOVA at 95% confidence using Fisher’s LSD test. Data are representation of one of two independent experiments showing similar results. (C) Viability of DU145, DU145GemR, and PC3GemR attached cells and MCTS using WST-1 assay. Cells were plated at a density of 10,000 cells/well in a 96-well plate and incubated at 37°C in a CO2 incubator for 3 hours for the cells to attach. The attached cells were treated with OP at the indicated doses with a combination of cyclo-RGDfK(TPP) peptide at 50 μM for 6 days. On day 7, 10 μL of WST reagent was added to each well. Cells were incubated for 2 hours at 37°C. Cell viability was expressed as a percent of control ± SEM of two independent experiments. Statistical analysis was carried out by using GraphPad Prism, and the results were compared by one-way ANOVA at 95% confidence using Fisher’s LSD test. (D) Phase-contrast images of PC3 cells at 10× objective treated with a combination of 50 μM cyclo-RGDfK(TPP) peptide and OP or without OP at 50, 100, or 200 μg/mL for 6 days. A total of 10,000 cells were plated per well in a 96-well plate for 6 days. (E) Spheroid volume and cell viability assays on PC3 MCTS. (F) Phase-contrast images of PC3 MCTS at 4× objective in the presence of 50 μM cyclo-RGDfK(TPP) peptide with 100 μg/mL OP or without OP with 10,000 cells per well in 96-well plate for 1–6 days of incubation.
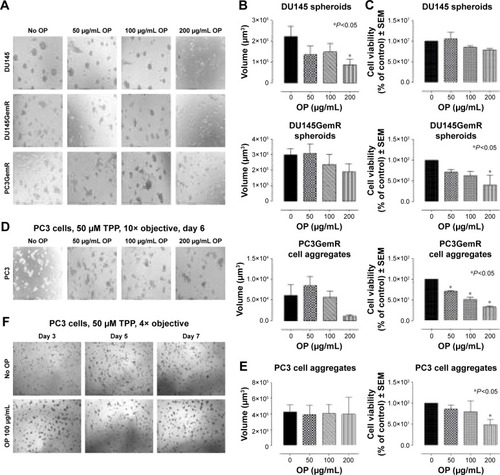
Figure 10 (A) Fluorescent microscopy images of DU145 cells stained with biotinylated lectins followed by DyLight 594 streptavidin. The cells were treated with 0.25 or 2.5 U neuraminidase (Neu) (Vibrio cholerae) for 24 hours before staining. Images were taken with epiflourescent microscope with 20× objective. (B) Quantitative analysis was done by assessing the density of cell staining corrected for background in each panel by using Corel Photo Paint 8.0 software. Each bar in the graphs represents the mean corrected density of staining ± SE (error bars) for all cells within the respective images. Results were compared by a one-way ANOVA at 95% confidence using Fisher’s LSD test. (C and D) Phase-contrast images of DU145, DU145GemR, PC3, and PC3GemR treated with a combination of 50 μM cyclo-RGDfK(TPP) peptide and Neu at concentrations of 0.025, 0.25, or 2.5 U for 6 days. A total of 10,000 cells were plated per well in a 96-well plate. MCTS volume was measured by using the method described in . Each bar in the graph represents mean MCTS volume ± SE (error bars) for all MCTS within the representative images. Results were compared by one-way ANOVA at 95% confidence interval using Fisher’s LSD test. Data are representation of one of two independent experiments showing similar results. Viability of DU145, DU145GemR, PC3, and PC3GemR attached cells and MCTS using WST-1 assay. Cell viability was expressed as a percent of control SEM of two independent experiments. Statistical analysis was carried out by using GraphPad Prism, and the results were compared by one-way ANOVA at 95% confidence using Fisher’s LSD test.
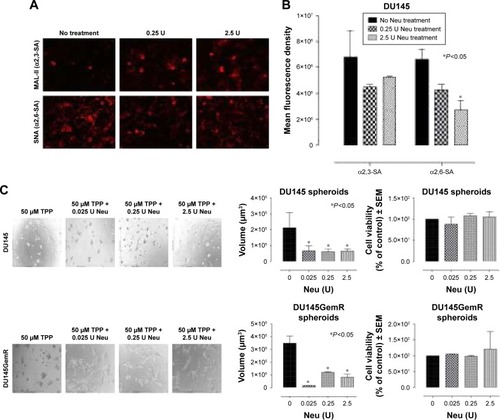
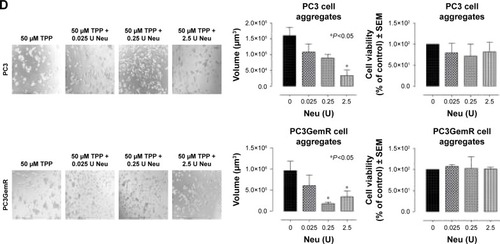
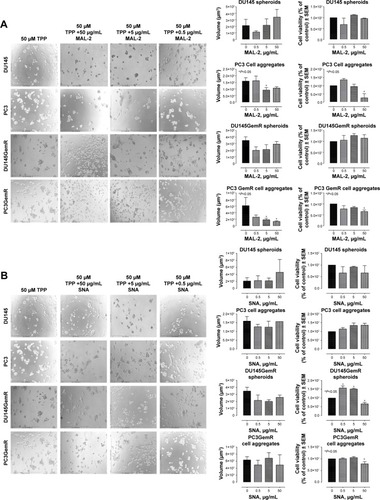
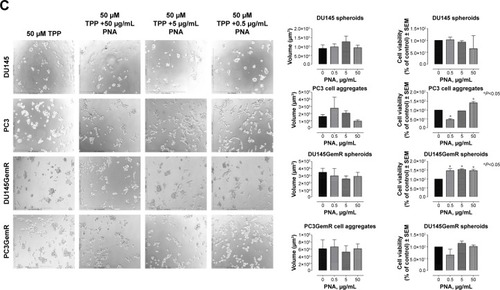
Figure 11 (A) MAL-2 (α2,3-SA), (B) SNA (α2,6-SA), and (C) PNA (specific for galactosyl (β-1,3) N-acetylgalactosamine). Phase-contrast images of DU145, DU145GemR, PC3, and PC3GemR treated with a combination of 50 μM cyclo-RGDfK(TPP) peptide and MAL-2/SNA/PNA at concentrations of 0.5, 5, and 50 μg/mL for 6 days. A total of 10,000 cells were plated per well in a 96-well plate. MAL-II and SNA shows decreased cell viability at 50 μg/mL.