Figures & data
Figure 1 Genistein inhibited adhesion of tongue cancer cells.
Notes: All cell lines were treated with 20, 50 and 100 µM of genistein. In the graphs, there is an initial phase of cell adhesion, followed by a plateau phase prior to a gradual period of proliferation. The adhesion of (A) HSC-3 cells, (C) PE/CA-PJ15 cells and (E) PE/CA-PJ49 cells is shown. Untreated cells were used as control (red curves). We monitored in real time the adhesion for 24, 48 and 72 hours after treatment and all cell index values of HSC-3 cells (B), PE/CA-PJ15 cells (D) and PE/CA-PJ49 cells (F). The results are the mean CI for 3 replicates ± SD. ****P<0.0001.
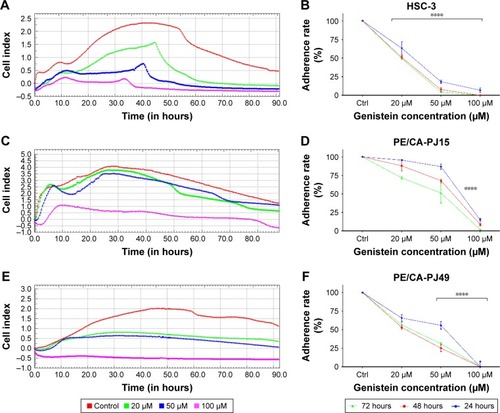
Figure 2 Inhibition of vitronectin expression.
Notes: Western blotting shows the inhibition of vitronectin expression after genistein treatment. Vitronectin is especially down-regulated at 48 hours with 100 µM of genistein and at 72 hours with 50 and 100 µM of genistein (A). Also shown is significance degree of tests used **P<0.005 (B).
Abbreviation: Ctrl, control.
Abbreviation: Ctrl, control.
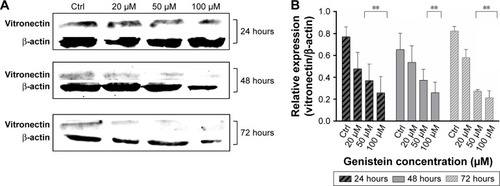
Figure 3 Variation in cell proliferation rate (%).
Notes: Cell index (CI) values were measured and converted to percentage rate using untreated cells as control (100% adhesion). (A) This shows a 50% reduction of adhesion posttreatment with 20 µM genistein at 24 hours. (B) The same reduction is present for treatment between 20 and 50 µM of genistein at 48 hours, and for 50 µM of genistein at 72 hours (C). Also shown is significance degree of tests used (**P<0.005, ***P<0.001, ****P<0.0001).
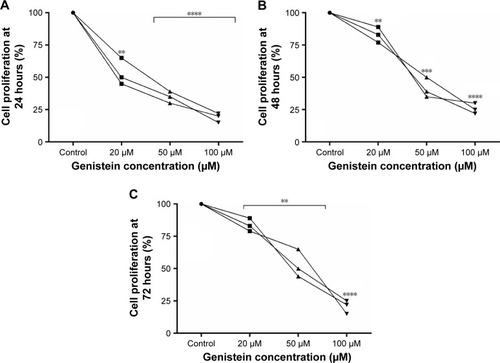
Figure 4 IC50 values.
Notes: Dose-response curves are shown for HSC-3 cells (A), PE/CA-PJ15 cells (C) and PE/CA-PJ49 cells (E). In each graph, the yellow square with the numbers 1, 2 and 3 indicates, respectively, IC50 values at 24, 48 and 72 hours. IC50 values are expressed as the mean (M) ± standard error of the mean (n=3) and they are shown as the average of all IC50 values of HSC-3 cells (B), PE/CA-PJ15 cells (D), PE/CA-PJ49 cells (F) at each time point. R2 of IC50 was 0.99.
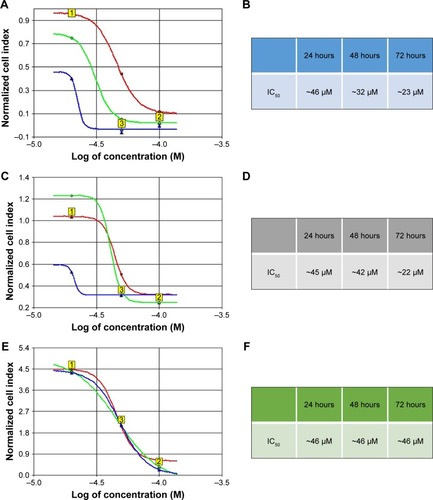
Figure 5 Genistein reduces the viability of tongue cancer cells.
Notes: Trypan blue test (A) and MTT assay (B) show a proportional reduction in cell viability with increasing concentrations of genistein. Experiments were performed at least 3 times and results are presented as the mean ± SD, and are statistically significant for ***P<0.001 and ****P<0.0001.
Abbreviation: Ctrl, control.
Abbreviation: Ctrl, control.
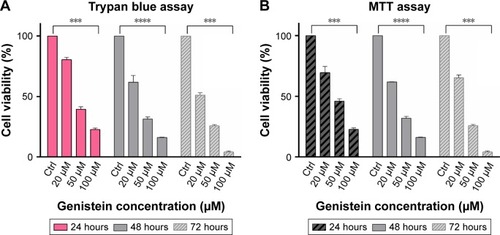
Figure 6 Effects of genistein on cell migration.
Notes: Significant increase of the gap size is more evident from T4 in tongue carcinoma cells compared to untreated control (Ctrl) (A). All experiments were performed at least 3 times and results are presented as the mean ± SD. *P<0.05, **P<0.01, ***P<0.001 (B).
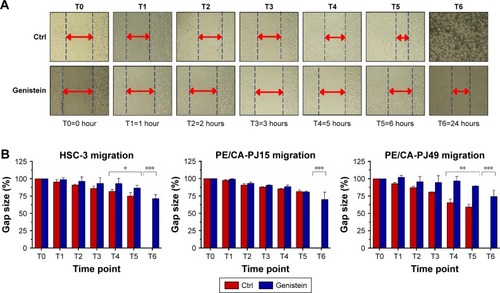
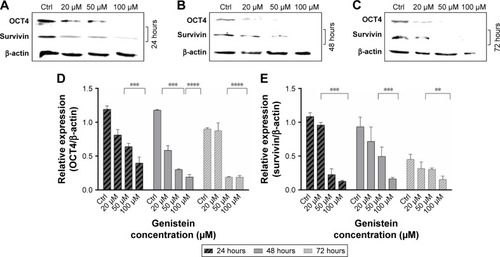
Figure 7 Genistein reduces tumorigenesis and promotes apoptosis.
Notes: Variation in level of expression of OCT4 and survivin. Genistein inhibits survivin and OCT4 at all time points considered (A–C). The significance degree of tests used is **P<0.005, ***P<0.001, ****P<0.0001 (D–E).
Abbreviation: Ctrl, control.
Abbreviation: Ctrl, control.