
Figures & data
Table 1 Characteristics of stage T3N0-1 NPC treatment with IC + CC or CC before and after propensity score matching
Table 2 Patterns of treatment failure in 237 patient pairs with stage T3N0-1 NPC
Figure 1 Kaplan–Meier survival curves for IC plus CC and CC alone in 237 patient pairs.
Notes: (A) Overall survival; (B) locoregional relapse-free survival; (C) distant metastasis-free survival; (D) progression-free survival.
Abbreviations: CC, concurrent chemotherapy; IC, induction chemotherapy.
Abbreviations: CC, concurrent chemotherapy; IC, induction chemotherapy.
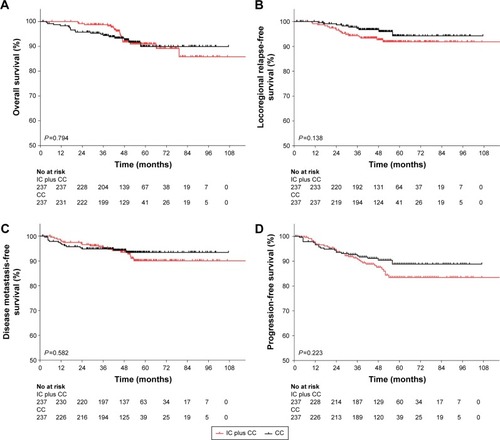
Table 3 Summary of prognostic factors in 237 patient pairs with stage T3N0-1 NPC by univariate analysis
Table 4 Summary of prognostic factors in 237 patient pairs with stage T3N0-1 NPC by multivariate analysis
Table 5 Grade 3–4 hematological toxicities in 237 patient pairs with stage T3N0-1 NPC