Figures & data
Figure 1 Selection process of all eligible articles of this meta-analysis.
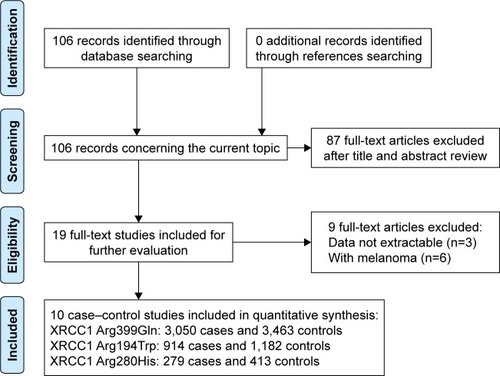
Table 1 The detailed characteristics of all studies included in this meta-analysis
Figure 2 Forest plot of the association between XRCC1 Arg399Gln polymorphism and non-melanoma skin cancer risk under allelic model.
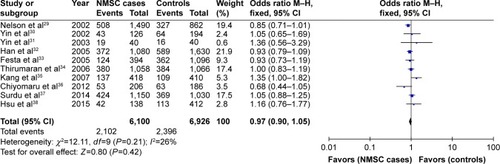
Table 2 Meta-analysis and stratified analyses of Arg399Gln, Arg194Trp, and Arg280His in the coding region of XRCC1 gene with NMSC risk under each genetic model
Figure 3 Forest plot obtained by subgroup analysis based on ethnicity showing the association between XRCC1 Arg399Gln polymorphism and non-melanoma skin cancer risk under heterogeneous model in Asian populations.
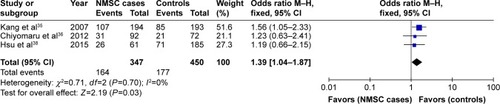
Figure 4 Forest plot obtained by subgroup analysis based on tumor types showing the association between XRCC1 Arg194Trp polymorphism and squamous-cell skin cancer risk under homogeneous model.
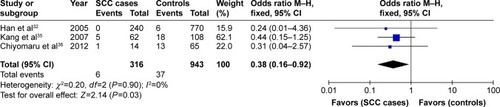
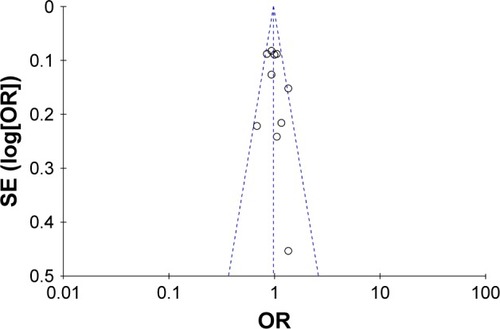
Figure 5 Funnel plot showing XRCC1 Arg399Gln polymorphism in non-melanoma skin cancer risk under allelic model.