Figures & data
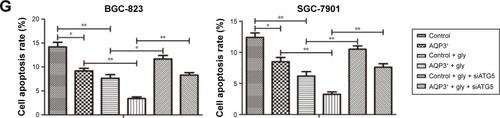
Figure 1 Knockdown of AQP3 promotes the cell apoptosis in vitro.
Notes: (A) AQP3 expression level was analyzed by real-time PCR in both tumor size ≥2 cm and <2 cm groups of human GC samples. (B) Cells were transfected with shCTL and shAQP3 respectively. The expression level of AQP3 was analyzed by using western blot. (C) After transfection, real-time PCR was used to detect the relative mRNA level of AQP3 in cells. (D) Same amount of cells were seeded into 96-well plates, after normal culture and starvation for 48 h respectively, the number of surviving cells was assessed by employing a Cell Counting kit 8. The results were expressed as OD value. (E and F) Cells were planted into 6-well plates after being transfected. Flow cytometry assay was used to analyze the cell apoptosis rates. Glycerol was supplemented in gradient concentrations (0.175 mol/L, 0.35 mol/L and 0.70 mol/L). All the experiments were performed independently three times. The data are expressed as the mean ± standard error of the mean. *P<0.05, **P<0.01 and #P<0.001.
Abbreviations: FITC, fluorescein isothiocyanate; GAPDH, glyceraldehyde 3-phosphate dehydrogenase; GC, gastric cancer; PI, propidium iodide; PCR, polymerase chain reaction.
Abbreviations: FITC, fluorescein isothiocyanate; GAPDH, glyceraldehyde 3-phosphate dehydrogenase; GC, gastric cancer; PI, propidium iodide; PCR, polymerase chain reaction.
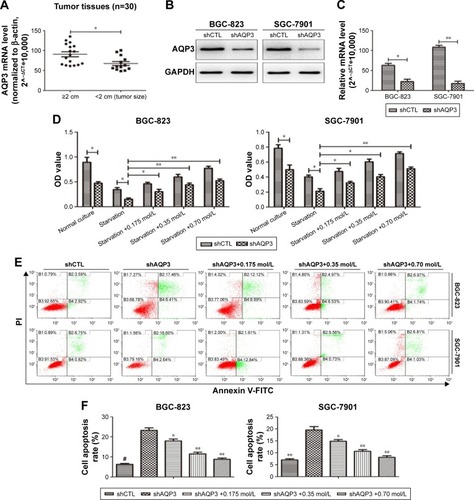
Table 1 Correlation between clinicopathological factors and AQP3 expression level in gastric cancer patients
Figure 2 Silencing of AQP3 decreases the cell viability of cancer cells in vivo.
Notes: (A) The AQP3 mRNA level in tumor tissues and corresponding normal mucosal tissues of human GC was detected by real-time PCR. (B–E) Cells were injected subcutaneously into both armpits of nude mice. Glycerol (2 g/kg) was injected intraperitoneally into the nude mice every 3 days one week later since the cell injection. Xenograft models were harvested after 4 weeks since cell injection. AQP3 expression level of xenograft models was validated. Tumor volumes were calculated and recorded, and the glycerol level of tumor tissues was detected. (F and G) Immunohistochemical staining was used to assess the expression level of Ki-67 protein in tumor tissues. Scale bar is 100 µm; magnification ×200. (H and I) The cell apoptosis rates were detected by adopting TUNEL detection assay. Scale bar is 100 µm; magnification ×200. All the experiments were performed independently three times. The data are expressed as the mean ± standard error of the mean. *P<0.05, **P<0.01 and #P<0.001.
Abbreviations: GC, gastric cancer; PCR, polymerase chain reaction; TUNEL, terminal deoxynucleotidyl transferase-mediated dUTP nick end labeling.
Abbreviations: GC, gastric cancer; PCR, polymerase chain reaction; TUNEL, terminal deoxynucleotidyl transferase-mediated dUTP nick end labeling.
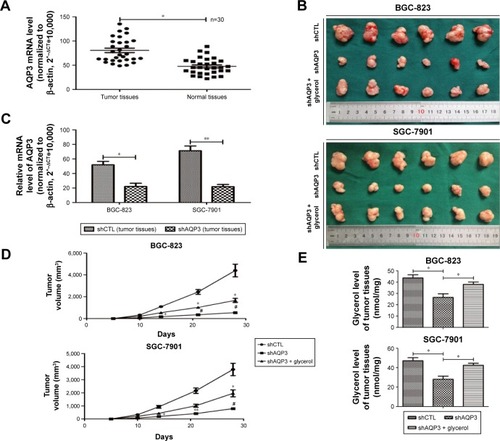
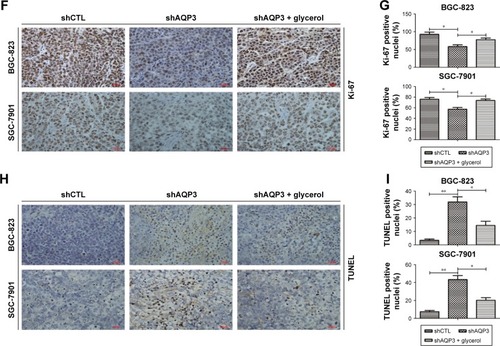
Figure 3 AQP3 inhibition induces decreased glycerol uptake and impaired lipid synthesis.
Notes: (A–C) A glycerol detection kit was used to quantify the glycerol levels of human GC tissues and cancer cells respectively. The AQP3 mRNA level was evaluated by real-time PCR. (D) The cellular TAG concentration was quantified by employing a TAG detection kit. (E and F) The intracellular lipid droplets (vermeil dots) were dyed with an Oil Red O staining kit, and the number of lipid droplets per cell was calculated for three times. At least 3 fields were randomly acquired in each group. Scale bar is 100 µm; magnification ×200. All the detection assays were performed following starvation for 48 h after cell transfection. Glycerol was added in gradient concentrations (0.175, 0.35 and 0.70 mol/L). And all the experiments were performed independently three times. The data are expressed as the mean ± standard error of the mean. *P<0.05, **P<0.01 and #P<0.001.
Abbreviations: PCR, polymerase chain reaction; TAG, triacylglycerol.
Abbreviations: PCR, polymerase chain reaction; TAG, triacylglycerol.
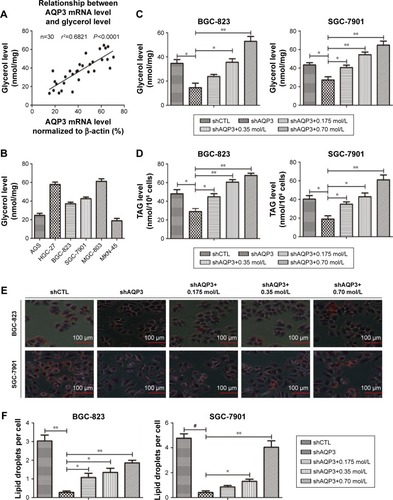
Figure 4 Suppression of autophagy is involved in the AQP3 deficiency-induced increased cell apoptosis.
Notes: (A and B) Western blot was used to analyze the expression levels of LC3 and P62 proteins in diverse group cells. And the LC3 and P62 expression levels were normalized to GAPDH. (C and D) The shCTL and shAQP3 cells were respectively transfected with GFP-LC3 plasmid by using Lipofectamine 2000. Then the cellular LC3 expression level was observed by adopting the laser confocal imaging. The average number of LC3 dots per cell was calculated for three times. Scale bar is 25 µm; magnification ×400. (E) After being fixed, cells were sectioned into ultrathin slices. Electron microscope was employed to observe the intracellular autophagosomes. The autophagosomes were indicated by the black arrows. Scale bars are 2 µm and 500 nm respectively; magnification ×2,500 and ×9,000, respectively. (G and H) Equal numbers of cells were cultured in 6-well plates. After supplementation of rapamycin (1 µM), the cell apoptosis rates were detected by using flow cytometry assay. Glycerol was added with gradient concentrations of 0.175, 0.35 and 0.70 mol/L in A and B and F and H, and at 0.35 mol/L in C, D and E. All the experiments were performed independently three times. The data are expressed as the mean ± standard error of the mean. *P<0.05, **P<0.01 and #P<0.001.
Abbreviations: DAPI, 4′,6-diamidino-2-phenylindole; GAPDH, glyceraldehyde 3-phosphate dehydrogenase; PI, propidium iodide.
Abbreviations: DAPI, 4′,6-diamidino-2-phenylindole; GAPDH, glyceraldehyde 3-phosphate dehydrogenase; PI, propidium iodide.
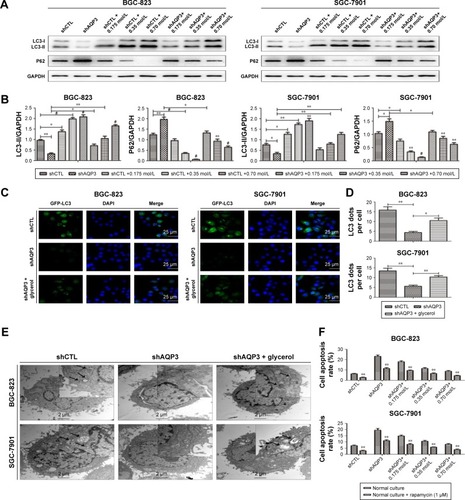
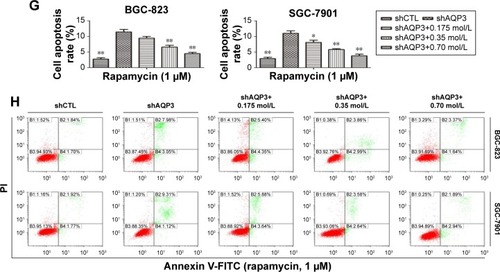
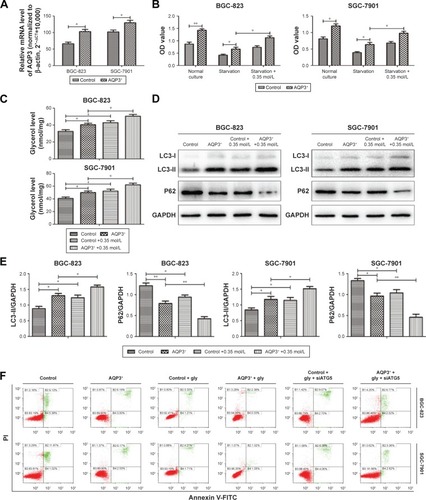
Figure 5 Overexpression of AQP3 enhances cell viability by upregulating glycerol uptake and autophagy.
Notes: (A) After transfection of AQP3 overexpression, the AQP3 expression level was analyzed by real-time polymerase chain reaction. (B) The same numbers of cells were seeded in 96-well plates, surviving cells were evaluated by adopting a Cell Counting kit 8 after normal culture and starvation for 48 h respectively. The results were expressed as OD value. (C) Cellular glycerol levels were quantified by using a glycerol detection kit. (D and E) Western blot was employed to detect the expression levels of LC3 and P62 proteins. And LC3 and P62 expression levels were normalized to GAPDH. (F and G) Same numbers of AQP3 overexpression and control cells were cultured in 6-well plates. The cell apoptosis rates were analyzed by flow cytometry assay after the supplementation of glycerol and transfection with siATG5. Glycerol was added with the concentration at 0.35 mol/L. All the experiments were performed independently three times. The data are expressed as the mean ± standard error of the mean. AQP3+: AQP3 overexpression, *P<0.05, **P<0.01.
Abbreviations: FITC, fluorescein isothiocyanate; GAPDH, glyceraldehyde 3-phosphate dehydrogenase; gly, glycerol; PI, propidium iodide.
Abbreviations: FITC, fluorescein isothiocyanate; GAPDH, glyceraldehyde 3-phosphate dehydrogenase; gly, glycerol; PI, propidium iodide.