Figures & data
Table 1 Patients characteristics (mean age 63.4 years, range 43–86 years)
Figure 1 Cavography and aortography.
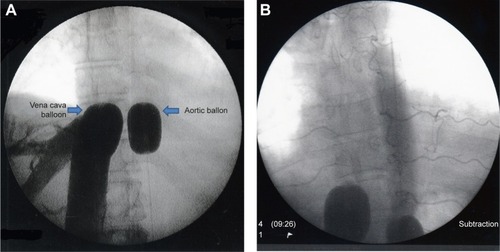
Figure 2 Scheme of isolated thoracic perfusion.
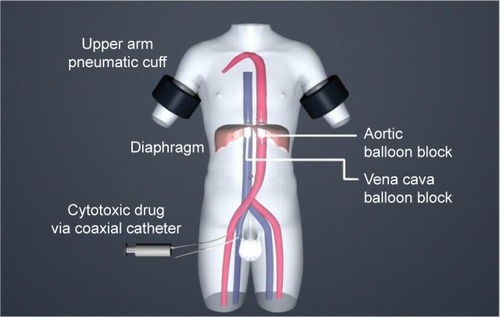
Figure 3 (A) Mitomycin plasma levels in isolated thoracic perfusion with chemofiltration versus intravenous application. Adapted with permission from Springer Nature book. Toxicity profiles with systemic versus regional chemotherapy. Induction Chemotherapy – Systemic and Locoregional, 2016, 497–506, Aigner KR, Knapp N;Citation7 (B) cisplatin plasma levels in the thoracic aorta (dotted line) and in the vena cava (baseline) after intra-arterial pulsatile infusion of 80 mg cisplatin, demonstrating the so-called first-pass effect in intra-arterial chemotherapy. Adapted with permission from Springer Nature book. Toxicity profiles with systemic versus regional chemotherapy. Induction Chemotherapy – Systemic and Locoregional, 2016, 497–506, Aigner KR, Knapp N.Citation7
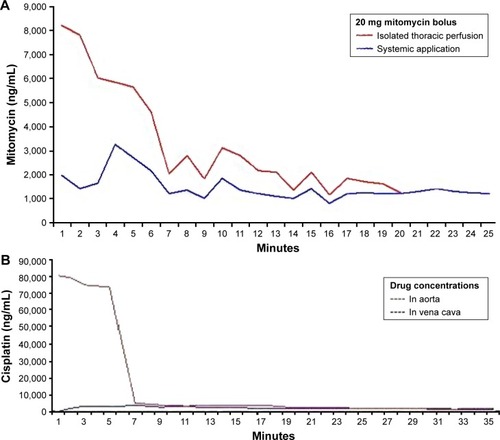
Figure 4 CT scan with a complete response.
Abbreviations: A, anterior; CT, computed tomography; P, posterior; R, right; VATS, video assisted thoracoscopic surgery.
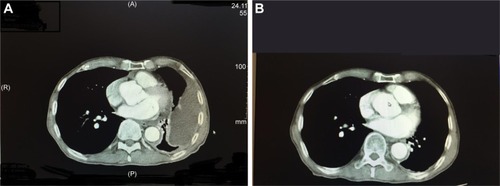
Figure 5 Kaplan–Meier plot of overall survival of all 28 patients.
Abbreviation: yr, year.
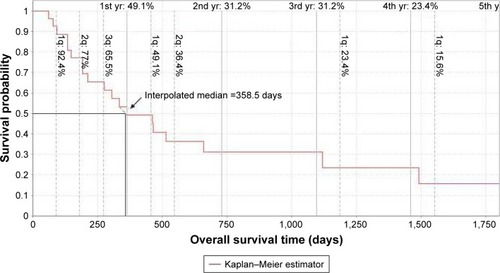
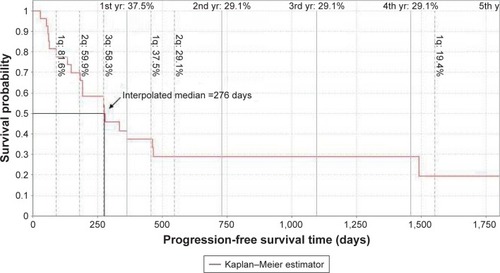
Figure 6 Kaplan–Meier plot of progression-free survival.
Abbreviation: yr, year.