Figures & data
Figure 1 The flowchart depicts the selection of studies for the meta-analysis and quality assessment.
Abbreviations: CRC, colorectal cancer; QUADAS-2, Quality Assessment of Diagnostic Accuracy Studies 2.
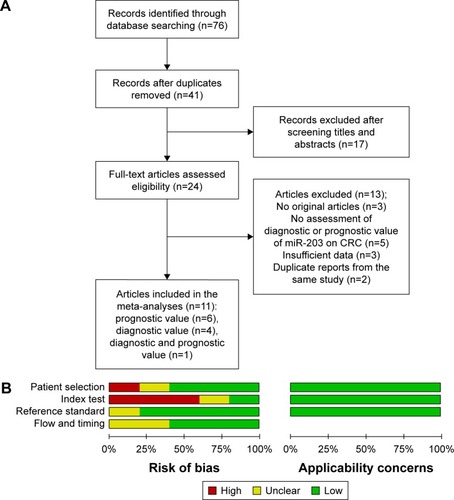
Table 1 Main characteristics of studies included in meta-analysis for diagnosis
Table 2 Main characteristics of the studies included in meta-analysis for prognosis
Figure 2 The forest plots show the pooled diagnosis index of miR-203 for the diagnosis of CRC.
Abbreviations: CI, confidence interval; CRC, colorectal cancer; DOR, diagnostic odds ratio; NLR, negative likelihood ratio; PLR, positive likelihood ratio.
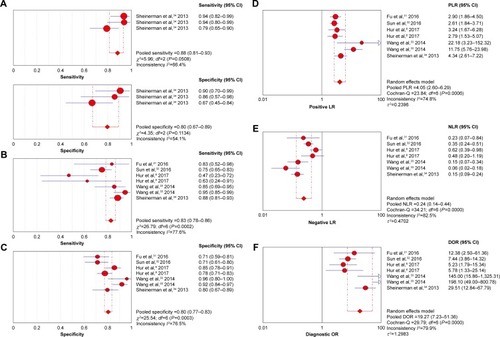
Figure 3 The SROC of miR-203 for the diagnosis of CRC.
Abbreviations: AUC, area under the curve; CRC, colorectal cancer; SENS, sensitivity; SPEC, specificity; SROC, summary receiver operating characteristic.
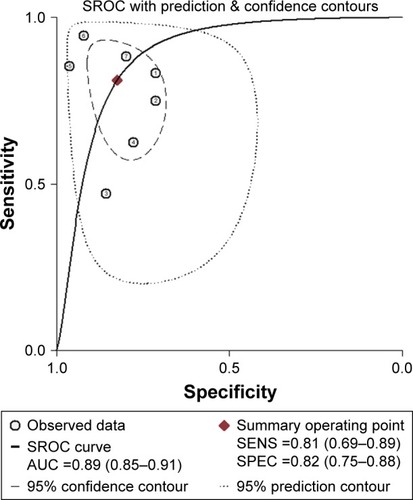
Figure 4 Forest plots of studies evaluating HRs of high miR-203 level.
Abbreviations: CI, confidence interval; CRC, colorectal cancer; HR, hazard ratio; OS, overall survival.
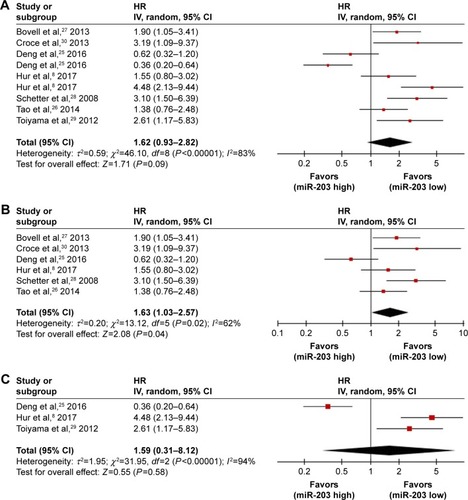
Table 3 Summary table of HRs and their 95% CI
Figure 5 Publication bias based on the eligible studies for diagnosis and prognosis.
Abbreviation: ESS, effective sample size.
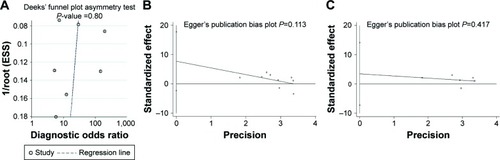
Figure S1 miR-203 diagnostic analysis based on the eligible studies.
Notes: (A) Fagan’s nomogram describes the possibility of miR-203 assay to confirm or exclude cancer patients. In detail, for any people with a pretest probability of 20% to have cancers, if the miR-203 test in cancer detection was positive, the posttest probability to have cancer would rise to 54%; while a negative result of miR-203 assay meant the posttest probability would drop to 5% for the same people. Hence, miR-203 assay may play an important role as an initial screening method for cancer. (B) The overall distribution of studies is summarized in the likelihood matrix. Each corresponds to a study.⑦, Sheinerman et alCitation34 was on the bottom left side of the matrix, indicating a sensitive “rule out” test. However, it reported reasonable sensitivity with incorporation bias from knowledge of a desaturation study outcome.
Abbreviations: RUQ, upper right quadrant; LUQ, upper left quadrant; RLQ, lower right quadrant; LLQ, lower left quadrant; LRN, negative likelihood ratio; LRP, positive likelihood ratio; NLR, negative likelihood ratio; PLR, positive likelihood ratio; prob, probability.
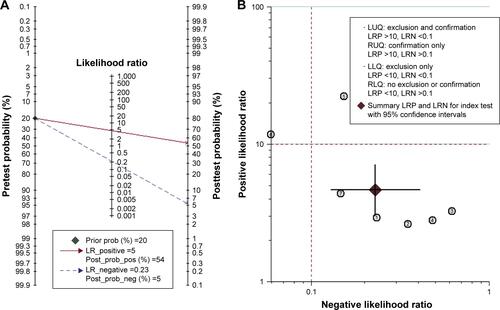
Figure S2 The sensitivity analysis based on the studies for prognosis of OS.
Notes: Forest plot for the sensitivity analysis shows the results of the meta-analysis did not change after the removal of any one paper. (A) The nine survival data from CRC tissue and serum; (B) six survival data from CRC serum.
Abbreviations: CRC, colorectal cancer; OS, overall survival.
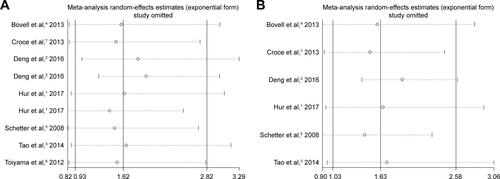
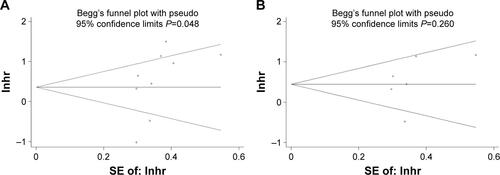
Figure S3 The publication bias based on the studies for prognosis of OS.
Notes: Publication bias from Begg’s test is shown by funnel plots. Every point represents one study. (A) The nine survival data from CRC tissue and serum; (B) six survival data from CRC serum.
Abbreviations: CRC, colorectal cancer; Inhr, In hazard ratio; OS, overall survival; SE, standard error.