
Figures & data
Table 1 Patient characteristics
Table 2 Comparison of patient characteristics and outcomes with or without orchiectomy
Figure 1 Survival difference in three age groups.
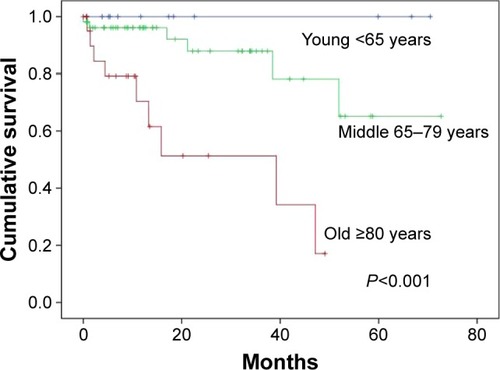
Figure 2 Survival difference between lower and higher quartiles of iPSA.
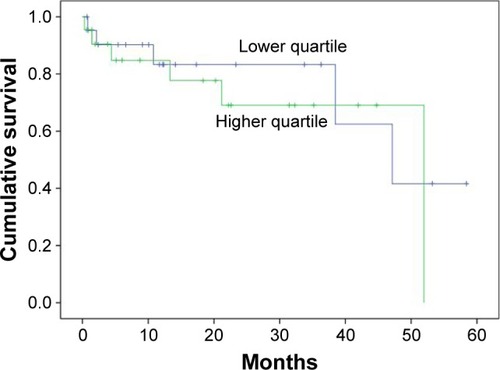
Figure 3 Dot plot of iPSA in patients who selected treatment options with or without orchiectomy.
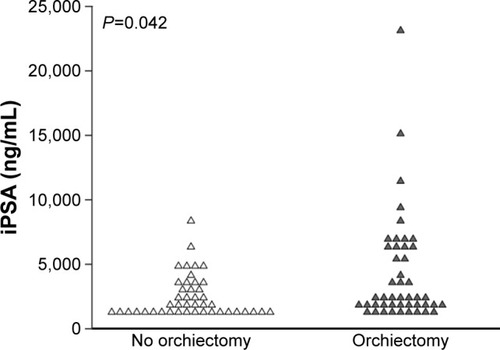
Figure 4 Survival difference between patient groups that chose treatment options with or without orchiectomy.
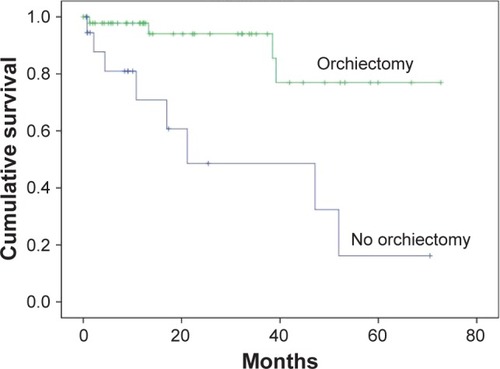
Figure 5 Survival difference between patient groups who did or did not reach TN following primary androgen deprivation therapy. (denoting nadir PSA value that over 90% of iPSA reduction after primary androgen deprivation therapy).
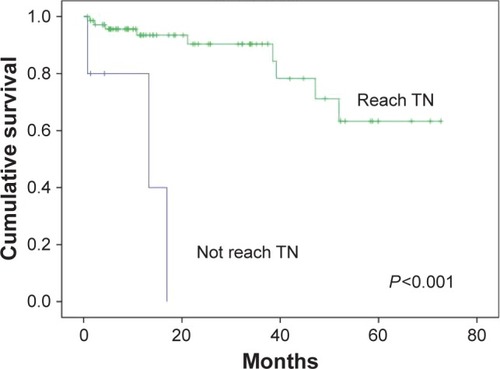
Figure 6 In patients that reached true nadir PSA, orchiectomy still provided survival advantage in this study cohort.
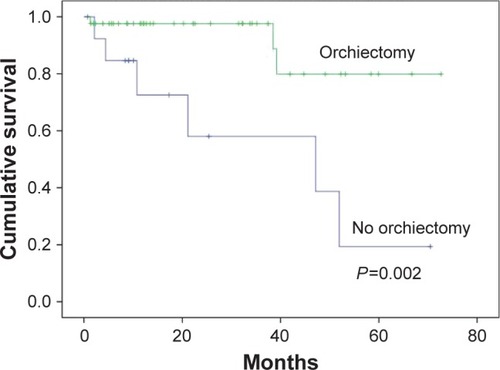
Table 3 Cox regression analysis