
Figures & data
Table 1 Baseline characteristics for all patients with salivary gland tumors
Figure 1 Representative examples of hematoxylin and eosin staining and immunohistochemical staining for PD-L1, PD-L2, PD-1, CD8+ tumor-infiltrating lymphocytes, and CTLA-4 in malignant salivary gland tumors (×200).
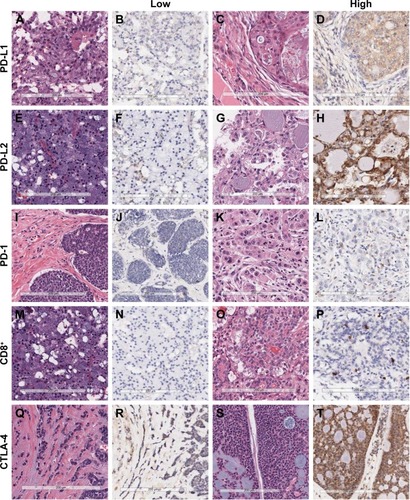
Figure 2 The proportion of staining intensity of PD-L1, PD-L2, and CTLA-4 expression in adenoid cystic carcinoma and salivary duct carcinoma.
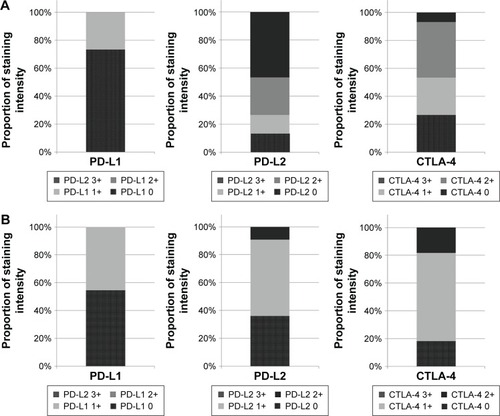
Table 2 Molecular marker expression in adenoid cystic carcinoma, salivary duct carcinoma, and mucoepidermoid carcinoma
Table 3 Associations between the clinicopathological variables and immune-related proteins in all patients
Figure 3 Relapse-free survival curve for all salivary gland tumors according to PD-L2 expression.
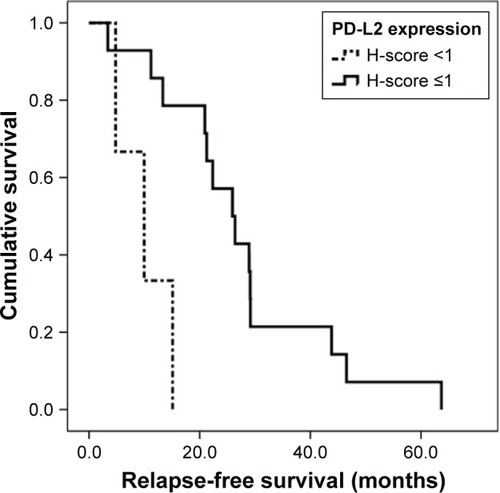
Table 4 Univariate analysis for relapse-free survival and overall survival in all patients
Table 5 Multivariate analysis for relapse-free survival in all patients
Table 6 Expression of PD-L1, PD-L2, CTLA-4, PD-1, and CD8+ tumor-infiltrating lymphocytes in primary and recurrent tumors