Figures & data
Figure 1 Expression of KDM2B and EZH2 in different ovarian tissue specimens. (A) KDM2B and EZH2 expression in the normal tissue, benign tumor, borderline tumor, and ovarian carcinoma (×200 magnification). (B) KDM2B mRNA relative levels in the normal tissue, benign tumor, borderline tumor, and ovarian carcinoma. (C) EZH2 mRNA relative levels in the normal tissue, benign tumor, borderline tumor, and ovarian carcinoma. (D) EZH2 expression was positively correlated to KDM2B (r=0.832, P<0.001).
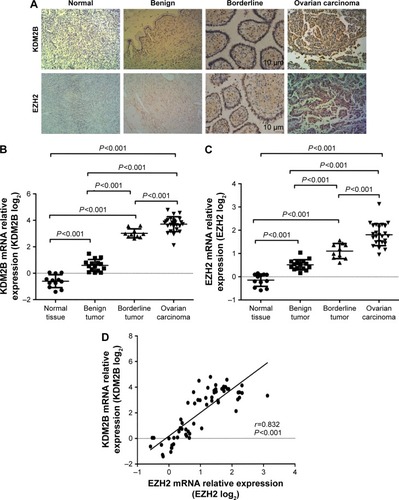
Table 1 KDM2B and EZH2 protein expression in different ovarian tissue specimens
Table 2 KDM2B and EZH2 expressions are associated with the clinicopathological features of ovarian carcinoma patients
Figure 2 KDM2B knockdown decreased EZH2 expression in A2780 and SKOV3 cells. (A) KDM2B mRNA in shKDM2B-A2780 cells and shKDM2B-SKOV3 cells were reduced after KDM2B knockdown (P<0.001). (B) EZH2 mRNA level was decreased in shKDM2B-A2780 cells and in shKDM2B-SKOV3 cells after KDM2B knockdown (P<0.001). (C) Western blot analysis of KDM2B and EZH2 protein levels in A2780 and SKOV3 cells. (D) KDM2B protein levels were decreased in shKDM2B-A2780 and shKDM2B-SKOV3 cells after KDM2B knockdown (P=0.005 and P<0.001). (E) The EZH2 protein levels were decreased in shKDM2B-A2780 and SKOV3 cells (P=0.005 and P=0.001). All assays were repeated three times.
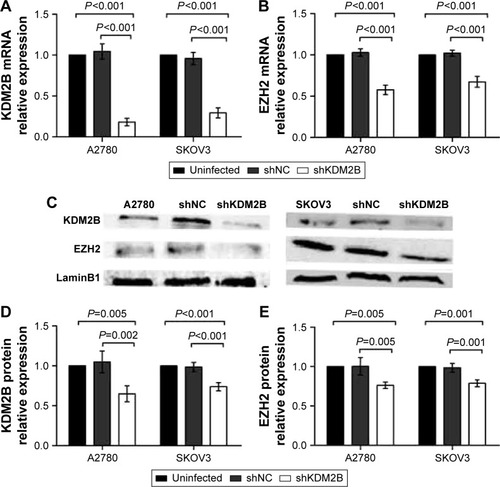
Figure 3 Decreased cell proliferation was detected with the CCK-8 cell counting kit and flow cytometry after KDM2B silencing. (A) The growth curve indicated that the optical densities of shKDM2B-A2780 were lower than those of the untransduced A2780 cells and shNC-A2780 on days 2, 3, 4, and 5. The differences were statistically significant (P<0.001). (B) The growth curve indicated that the optical densities of shKDM2B-SKOV3 were reduced on days 2, 3, 4, and 5 compared with untransduced SKOV3 and shNC-SKOV3 cells, with a statistical difference of P<0.001. (C) Cell cycle analysis of shNC-A2780 shows the G1-, G2-, and S-phase cells. (D) Cell cycle analysis of shKDM2B-A2780 shows the G1-, G2-, and S-phase cells. (E) The percentages of shNC-A2780 and shKDM2B-A2780 in the G0/G1 (P<0.001), S (P=0.001), and G2/M phases (P=0.012) were determined by three replicates. All assays were repeated three times.
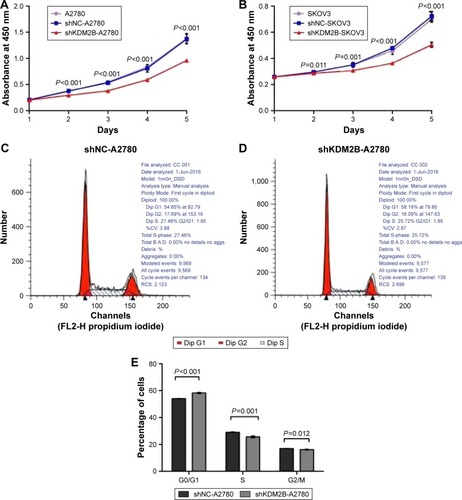
Figure 4 Cell migration was reduced after KDM2B knockdown. (A) Scratch healing rates of A2780 cells decreased at 24 h and 48 h after KDM2B knockdown (P<0.05). (B) Representative pictures of wound healing assay of A2780 cells (×100 magnification). (C) Scratch healing rates of SKOV3 cells decreased at 24 h and 48 h after KDM2B knockdown (P<0.001). (D) Representative pictures of wound healing assay of SKOV3 cells (×100 magnification). (E) Penetrated cell numbers of A2780 cells were reduced after KDM2B silencing (P<0.001). (F) Representative results of transwell assay of A278 cells after KDM2B silencing. (G) Penetrated cell numbers of SKOV3 cells were reduced after KDM2B silencing (P<0.001). (H) Representative results of transwell assay of SKOV3 cells after KDM2B silencing. All assays were repeated three times. Scale bar =100 µm.
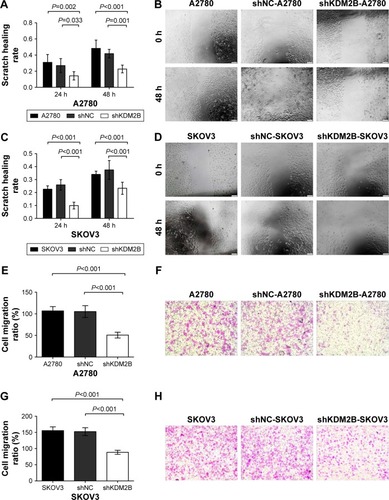
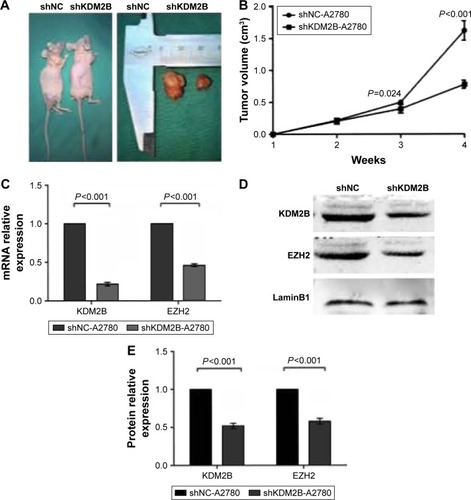
Figure 5 Ovarian tumor growth was inhibited after KDM2B repression in vivo. (A) Tumor volume of the shKDM2B-A2780 group in the nude mouse xenograft model was significantly decreased compared with tumors obtained from the shNC-A2780 group. (B) Tumor volume of the shKDM2B-A2780 group in nude mouse xenograft model was significantly decreased compared to tumors present in the shNC-A2780 group at 3 and 4 weeks (P=0.024 and P<0.001). (C) KDM2B and EZH2 mRNA expression was repressed in the shKDM2B-A2780 group compared with the shNC-A2780 group (P<0.001). (D) Western blot analysis of KDM2B and EZH2 protein in shNC-A2780 and shKDM2B-A2780 groups. (E). EZH2 protein expression was repressed in the shKDM2B-A2780 group compared with the shNC-A2780 group (P<0.001). All assays were repeated three times.