Figures & data
Figure 1 The presentation of the DCLs. The expression profile was used for differential co-expression analysis to identify DCLs. (A) The cartoon sketch presented the association types between genes, and the DCLs were grouped into three different types. (B) The percentages of three types of DCLs. The loss-of-association DCLs was the predominant type.
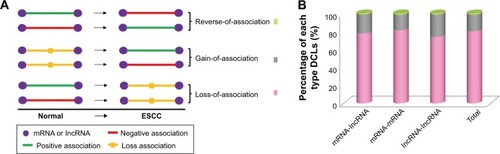
Figure 2 Comprehensive analysis of the distribution and function of DRLs. The normal and tumor regulatory networks were constructed for the DCmRNAs. With the comparison of the two regulatory networks, 2,208 DRLs were identified. (A) The proportions of the five different types of DRLs. (B) Functional enrichment analysis for each type of DRLs indicated the specific function of DRLs (Benjamin adjust P-value <0.01).
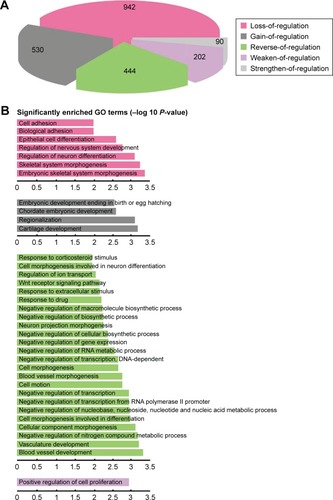
Figure 3 An integrative pipeline for transcriptome-wide identification of prognostic lncRNAs. (A) Differential co-expression analysis identified 923 DClncRNAs by using the mRNA and lncRNA expression profile. Part of differential co-expression network is shown in the plot. The green triangles are the DClncRNAs, the purple triangles are lncRNAs and the purple ellipses are mRNAs. (B) A total of 820 cancer-related lncRNAs were found through differential co-expression with cancer genes, drug targets and ESCC genes. (C) Differential expression analysis was performed to narrow down the candidate lncRNAs. The fold changes of top 10 lncRNAs are presented in the plot. (D) The 5-fold cross-validation was used to identify the optimal combination for predicting the survival of ESCC patients. K-means algorithm and Kaplan–Meier survival analysis were used to calculate the prognostic accuracies of 1,023 combinations. The highest prognostic accuracies of 1–10 lncRNA combinations and the prognostic accuracies of 45 2-lncRNA combinations are shown in the plot.
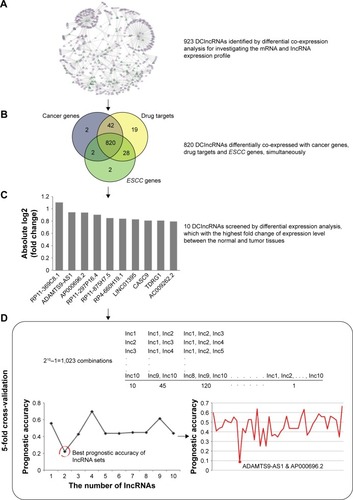
Figure 4 The combination of two novel lncRNAs predicts the clinical outcomes of ESCC patients. The expression profiles of the lncRNAs are shown in the top panel. Kaplan–Meier survival curves shown by the combination of ADAMTS9-AS1 and AP000696.2 were able to distinguish patients with different clinical outcomes in (A) the training dataset (119 patients) and (B) the testing dataset (60 patients). The survival months are shown along the x-axis, and overall survival rates are shown along the y-axis.
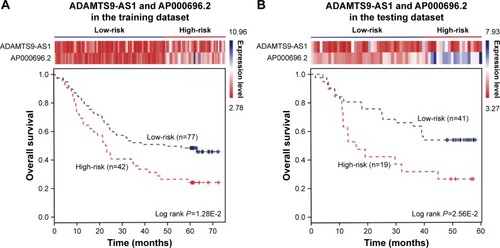
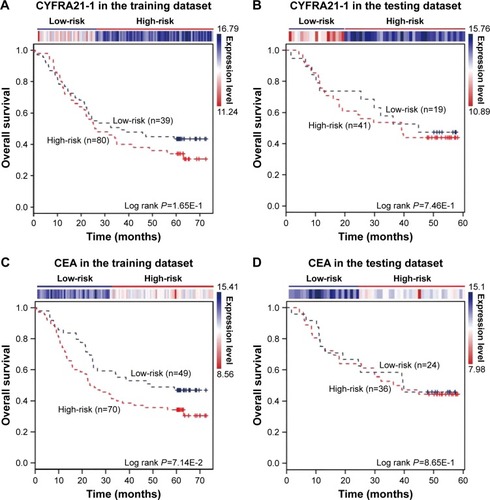
Figure 5 CYFRA21-1 and CEA predict the clinical outcomes of ESCC patients. The expression profiles of the CYFRA21-1 and CEA are shown in the top panel. CYFRA21-1 or CEA could not distinguish ESCC patients with different clinical outcomes in (A, C) the training dataset (119 patients) and (B, D) the testing dataset (60 patients). The survival months are shown along the x-axis and overall survival rates are shown along the y-axis.