
Figures & data
Figure 1 IHC of paraffin-embedded esophageal cancer. (A) Hematoxylin–eosin staining of VM channel on the left lined only by tumor cells which are negative for CD34 staining (red arrow). The panel on the right shows endothelium-dependent vessels are positive for CD34 staining (black arrow) (magnification: 200×). (B) E-cadherin expression in esophageal cancer (magnification: 200×). (C) CD66b expression in esophageal cancer (magnification: 400×).
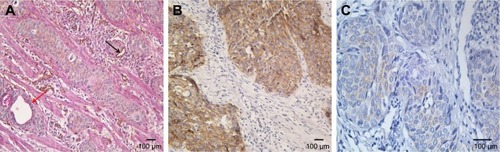
Figure 2 The expressions of VM (A and C), E-cadherin (B and E), and tumor-infiltrating neutrophil (CD66b, D and F) in esophageal cancer. (A, 200×) The expression of VM (red arrows and black arrows refer to endothelium-dependent vessels) was positive, whereas the expression of E-cadherin was weak in the same sample (B, 200×). (C, 200×) The expression was VM was existent, and the expression of tumor-infiltrating neutrophil was strong in the same sample (D, 400×). (E, 200×) The expression of E-cadherin was strong, whereas tumor-infiltrating neutrophil was almost absent in the same sample (F, 400×).
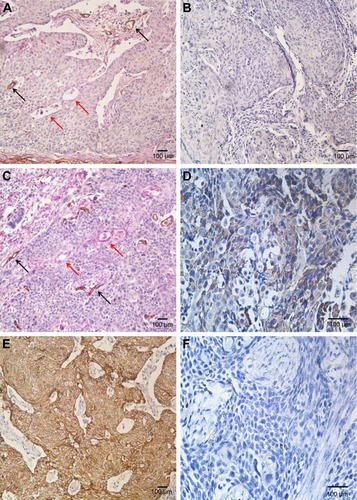
Table 1 Clinicopathologic significance of VM in 117 esophageal squamous cell carcinoma patients
Table 2 Spearman’s rho analyses of VM and clinicopathological features
Figure 3 Kaplan–Meier curves for clinical reference values. It is significantly different between positive-VM group and negative-VM group (A: OS, log-rank test, χ2=28,762, P<0.001; D: DFS, log-rank test, χ2=25.320, P<0.001), and statistically significant differences were found between CD66b low-expression group and CD66b high-expression group (C: OS, log-rank test, χ2=10.962, P=0.001; F: DFS, log-rank test, χ2=9.225, P=0.002). But there is no statistically significant difference between E-cadherin low-expression group and high-expression group (B: OS, log-rank test, χ2=0.051, P=0.821; E: DFS, log-rank test, χ2=0.064, P=0.800).
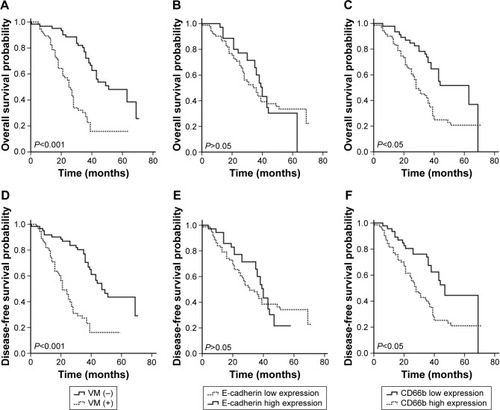
Table 3 Cox-proportional hazard analyses