
Figures & data
Figure 1 The research flowchart.
Abbreviations: CT, computed tomography; NPV, negative predictive value; PPV, positive predictive value; ROC, receiver operating characteristic; Se, sensitivity; Sp, specificity.
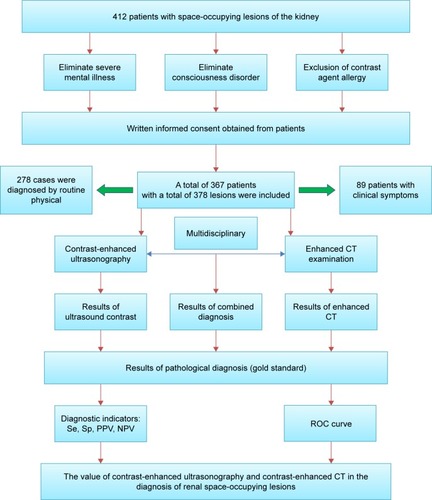
Table 1 Pathological results of 378 lesions
Table 2 Comparison of parameters of the time–intensity curves in the benign and malignant lesions
Table 3 Comparison of diagnoses of the space-occupying lesions using the three methods (n)
Table 4 Comparison of diagnostic performance of the three methods in the space-occupying lesions of the kidney (%, 95% CI)
Figure 2 ROC curves with the three methods.
Note: Diagonal segments are produced by ties.
Abbreviations: CECT, contrast-enhanced CT; CEUS, contrast-enhanced ultrasound; CT, computed tomography; ROC, receiver operating characteristic.
Abbreviations: CECT, contrast-enhanced CT; CEUS, contrast-enhanced ultrasound; CT, computed tomography; ROC, receiver operating characteristic.
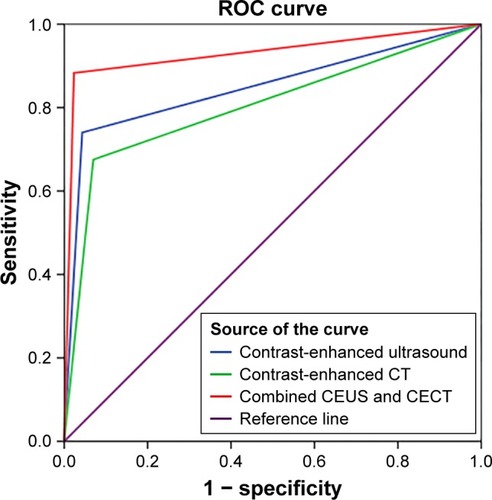
Table 5 Comparison of the area under the ROC curve with the three methods