
Figures & data
Table 1 Functional and pathway enrichment analysis of upregulated and downregulated DEGs in HNSCC
Figure 1 PPI network of differentially expressed genes.
Notes: Blue represents downregulated DEGs; red represents upregulated DEGs.
Abbreviations: PPI, protein–protein interaction; DEGs, differentially expressed genes.
Abbreviations: PPI, protein–protein interaction; DEGs, differentially expressed genes.
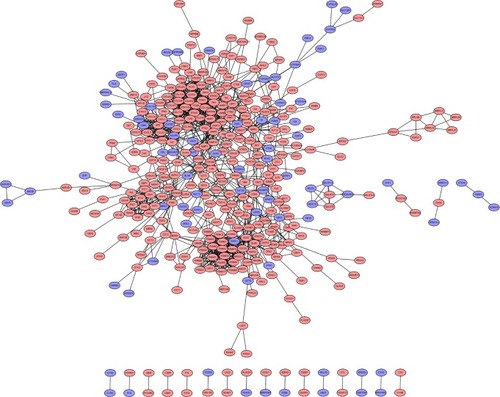
Figure 2 Functional modules in the PPI network.
Notes: From PPI networks of DEGs with combined score >0.8, we clustered two functional modules, using MCODE: module 1 (A) and module 2 (B). Blue represents downregulated DEGs; red represents upregulated DEGs.
Abbreviations: PPI, protein–protein interaction; DEGs, differentially expressed genes; MCODE, Molecular Complex Detection.
Abbreviations: PPI, protein–protein interaction; DEGs, differentially expressed genes; MCODE, Molecular Complex Detection.
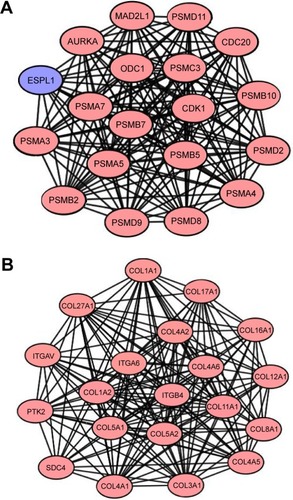
Table 2 The hub genes that had a degree >22 in PPI network
Table 3 Functional and pathway enrichment analysis of the DEGs in modules
Figure 3 Kaplan–Meier curves depicting OS in the TCGA HNSCC cohort with high and low expression of PMSA7 (A), ITGA6 (B), ITGB4 (C) and APP (D), respectively. Abbreviations: OS, overall survival; HNSCC, head and neck squamous cell carcinoma; HR, hazard ratio; CI, confidence interval.
