97
Views
20
CrossRef citations to date
0
Altmetric
Review

The diagnostic and prognostic values of Ki-67/MIB-1 expression in thyroid cancer: a meta-analysis with 6,051 cases

, , , , , & show all
Pages 3261-3276 | Published online: 03 Jul 2017

Figures & data

Figure 1 Flow diagram of reviewing and selecting studies.

Figure 1 Flow diagram of reviewing and selecting studies.

Figure 2 Risk of bias of studies included in diagnosis with QUADAS-2 tool.

Figure 2 Risk of bias of studies included in diagnosis with QUADAS-2 tool.

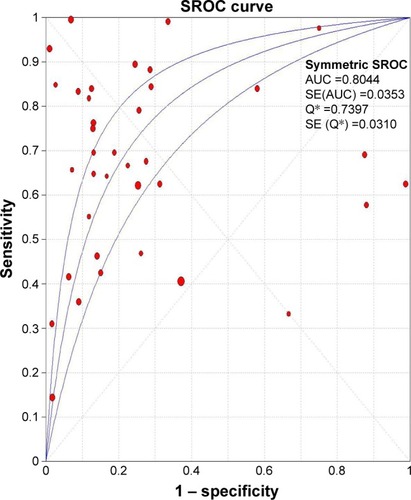
Table 1 Characteristics of studies included in diagnosis

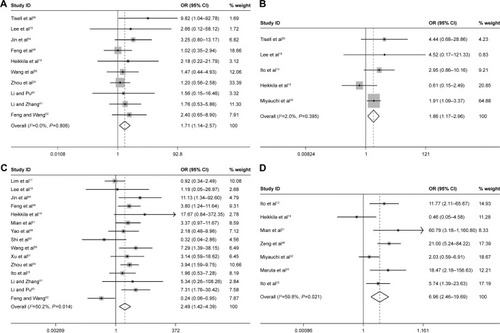
Table 2 The relationships between Ki-67/MIB-1 expression and clinicopathologic parameters

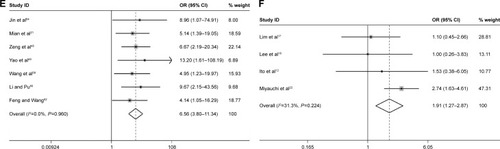
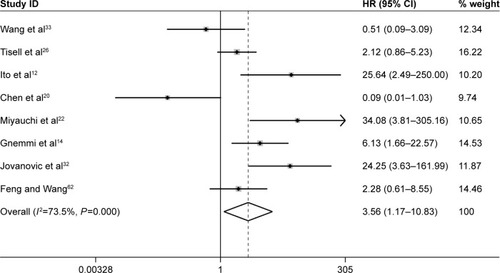
Table 3 The features of the studies relating Ki-67/MIB-1 to patients’ prognosis

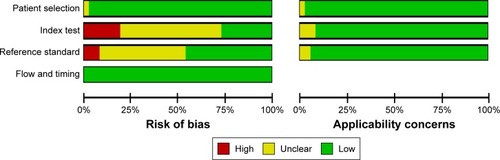
Table 4 Quality assessment of included studies according to NOS

Figure 3 Forest plots for the accuracy of Ki-67/MIB-1 for the diagnosis of thyroid cancer.

Notes: (A) Sensitivity; (B) specificity; (C) positive LR (LR+); (D) negative LR (LR−).
Abbreviations: CI, confidence interval; df, degrees of freedom; LR, likelihood ratio.
Figure 3 Forest plots for the accuracy of Ki-67/MIB-1 for the diagnosis of thyroid cancer.

Figure 4 Forest plot of DOR of Ki-67/MIB-1 for the diagnosis of thyroid cancer.

Note: The pooled DOR of Ki-67/MIB-1 for the diagnosis of thyroid cancer was 8.54 (95% CI: 5.03–14.49).
Abbreviations: CI, confidence interval; df, degrees of freedom; DOR, diagnostic odds ratio; OR, odds ratio.
Figure 4 Forest plot of DOR of Ki-67/MIB-1 for the diagnosis of thyroid cancer.

Figure 5 SROC curve for the accuracy of Ki-67/MIB-1 in the diagnosis of thyroid cancer.

Notes: The area under the SROC curve was 0.804 (SE =0.031). Q* represents the index to judge the accuracy of the diagnostic experiment.
Abbreviations: AUC, area under the curve; SE, standard error; SROC, symmetric receiver operating characteristic.
Figure 5 SROC curve for the accuracy of Ki-67/MIB-1 in the diagnosis of thyroid cancer.

Figure 6 Forest plots of Ki-67/MIB-1 and clinicopathologic parameters in thyroid cancer patients.

Notes: (A) Age; (B) tumor size; (C) lymph node metastasis; (D) metastasis status; (E) TNM stage; (F) extrathyroid extension. Weights are from random-effects analysis.
Abbreviations: CI, confidence interval; OR, odds ratio; TNM, tumor node metastasis.
Figure 6 Forest plots of Ki-67/MIB-1 and clinicopathologic parameters in thyroid cancer patients.

Figure 7 Meta-analysis evaluating the association between Ki-67/MIB-1 and DFS (fixed-effect analysis).

Note: The combined fixed-effect HR was 5.19 (95% CI: 3.18–8.46, P<0.001), indicating that high level of Ki-67/MIB-1 was associated with worse DFS.
Abbreviations: CI, confidence interval; DFS, disease-free survival; HR, hazard ratio.
Figure 7 Meta-analysis evaluating the association between Ki-67/MIB-1 and DFS (fixed-effect analysis).

Figure 8 Meta-analysis evaluating the association between Ki-67/MIB-1 and mortality (random-effect analysis).

Notes: The pooled fixed-effect HR was 3.56 (95% CI: 1.17–10.83, P=0.025), indicating that high level of Ki-67/MIB-1 was associated with increased of risk of mortality. Weights are from random-effect analysis.
Abbreviations: CI, confidence interval; HR, hazard ratio.
Figure 8 Meta-analysis evaluating the association between Ki-67/MIB-1 and mortality (random-effect analysis).

Figure 9 Assessment of publication bias for clinicopathologic parameters.

Notes: (A) Age; (B) tumor size; (C) lymph node metastasis; (D) metastasis status; (E) TNM stage; (F) extrathyroid extension.
Abbreviations: OR, odds ratio; SE, standard error; TNM, tumor node metastasis.
Figure 9 Assessment of publication bias for clinicopathologic parameters.

Figure 10 Assessment of publication bias for DFS and mortality.

Notes: (A) DFS; (B) mortality.
Abbreviations: DFS, disease-free survival; HR, hazard ratio; SE, standard error.
Figure 10 Assessment of publication bias for DFS and mortality.

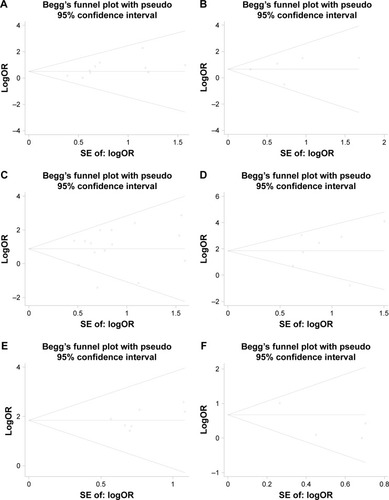
Table S1 Subgroup analysis evaluating the diagnostic value of Ki-67/MIB-1 in thyroid cancer

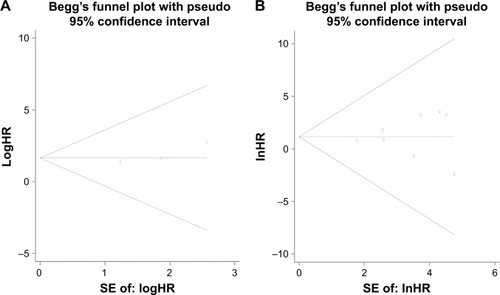
Table S2 Subgroup analysis evaluating the prognostic value of Ki-67/MIB-1 for mortality in thyroid cancer