
Figures & data
Figure 1 Boxplots for gene expression of each sample in GSE46602 (A) and GSE55945 (B).
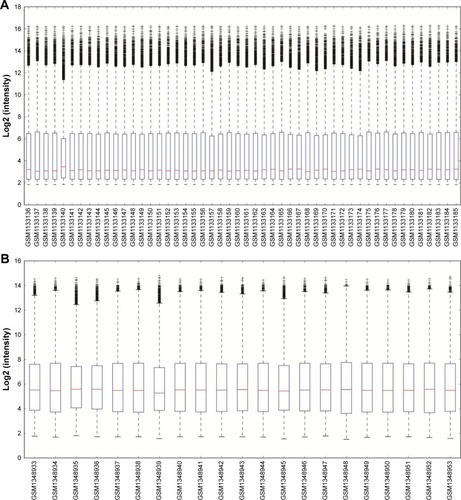
Figure 2 Venn diagram of the DEGs in GSE46602 and GSE55945 (A) and fold change correlation between the two datasets (B).
Abbreviation: DEGs, differentially expressed genes.
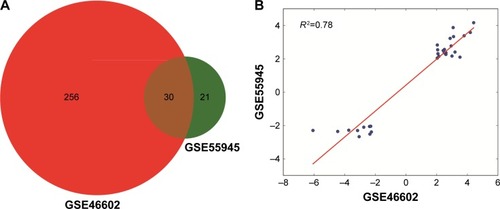
Figure 3 Heat map showing the expression pattern of 30 common DEGs in all tumor and normal samples.
Notes: The x-axis represents samples and y-axis represents genes. The bar on the top indicates the type of sample using red (tumor) and blue (normal).
Abbreviation: DEGs, differentially expressed genes.
Abbreviation: DEGs, differentially expressed genes.
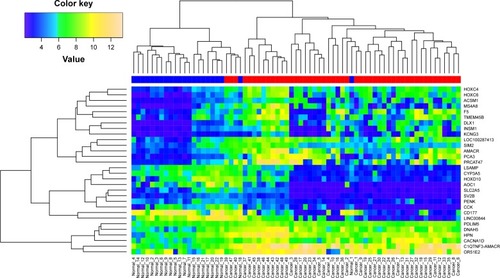
Table 1 The identified 30 common DEGs in GSE46602 and GSE55945
Table 2 KEGG pathway and GO enrichment results for the common DEGs
Figure 4 Regulation network between the identified common DEGs and reported miRNAs.
Note: Pink hexagons represent DEGs and green circles represent miRNAs.
Abbreviation: DEGs, differentially expressed genes.
Abbreviation: DEGs, differentially expressed genes.
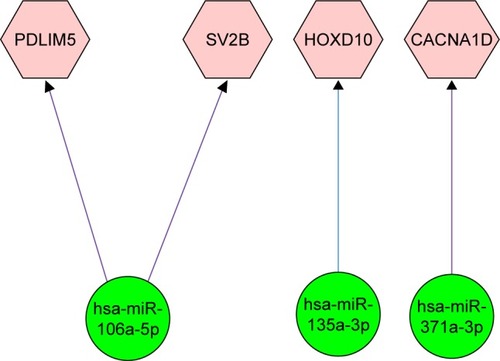
Figure 5 Kaplan–Meier curves of GSE16560 dataset (A) and GSE40272 (B).
Notes: Censoring samples are marked with “+”. The x-axis represents time to event and y-axis represents percentage. The number of samples, censored number, and CI are shown in the insets. High- and low-risk groups are labeled with red and green curves, respectively. The red data represent high-risk patients, and the green data represent low-risk patients.
Abbreviation: CI, concordance index.
Abbreviation: CI, concordance index.
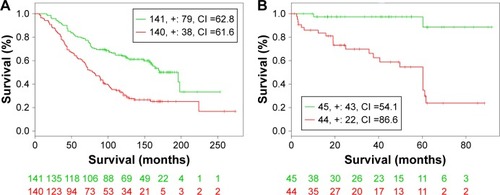
Table 3 Virtual validation results of prognostic performance