Figures & data
Figure 1 Transcriptional levels of TLR7 and TLR8 predict the clinical outcome of patients with melanoma. Survival analysis of melanoma patients (TCGA database) is shown with high and low expressions of TLR7 (A) and TLR8 (B). Survival analysis of melanoma patients (GSE19234) is shown with high and low expressions of TLR7 (C) and TLR8 (D). The patients were divided into two groups based on the median mRNA expression levels of TLR7 and TLR8.
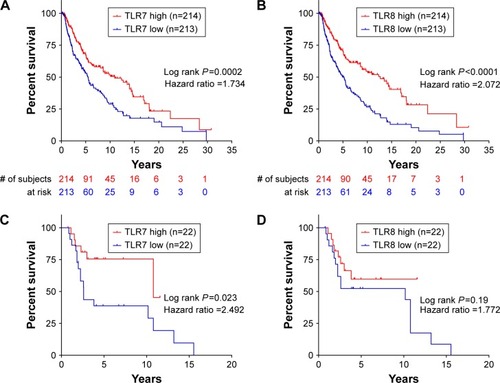
Table 1 Correlation analysis of TLR7/8 and genes of interest
Table 2 Multivariate cox analyses applied to survival model
Figure 2 Correlation analysis between expressions of TLR7 and factors associated with dendritic cells (DC). Correlation analysis between (A) TLR7 and ITGAM, (B) TLR7 and ITGAX, (C) TLR7 and IFNB, and (D) TLR7 and IRF3.
Abbreviations: TLR, Toll-like receptor; IRF3, interferon regulatory factor 3; IFNB, interferon B.
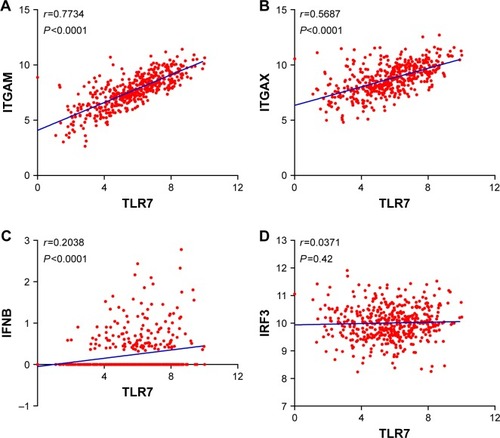
Figure 3 Correlation analysis between expressions of TLR7 and chemokines and their receptors. Correlation analysis between (A) TLR7 and CCR2, (B) TLR7 and CCR5, (C) TLR7 and CCL2, and (D) TLR7 and CCL5.
Abbreviation: TLR, Toll-like receptor.
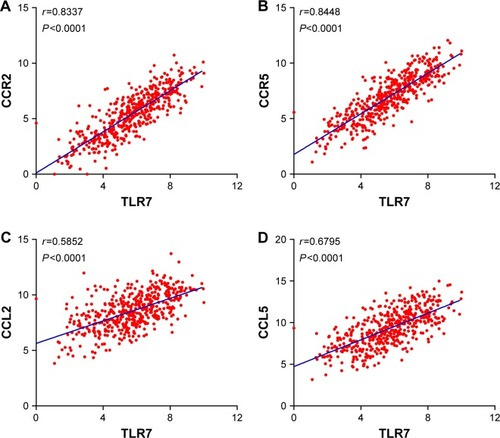
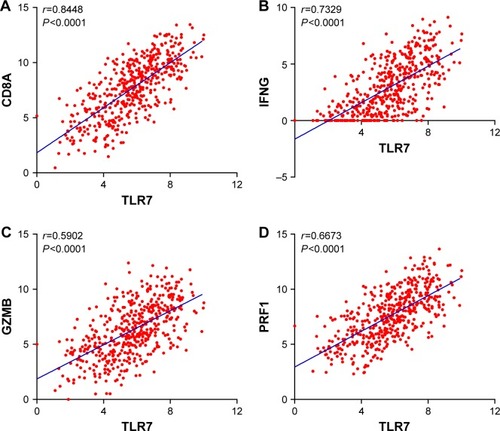
Figure 4 Correlation analysis between expression levels of TLR7 and CD8+ cytotoxic T-cell markers. Correlation analysis between (A) TLR7 and CD8A, (B) TLR7 and IFNG, (C) TLR7 and GZMB, and (D) TLR7 and PRF1.
Abbreviations: TLR, Toll-like receptor; IFNG, interferon gamma.