Figures & data
Figure 1 Circ-104916 expression in GC tissues.
Notes: (A) The expression of circ-104916 was validated by qPCR in seventy patients. Log2 fold changes in circ-104916 expressions (T/N) of each case are plotted. (B) The expression level of circ-104916 was significantly downregulated in tumor tissues. **P<0.01.
Abbreviation: qPCR, quantitative polymerase chain reaction.
Abbreviation: qPCR, quantitative polymerase chain reaction.

Figure 2 Clinicopathological factors with the expression level of circ-104916.
Notes: (A) The expression of circ-104916 was much lower in the deeper invasion depth patients. (B) Circ-104916 expression was downregulated in the patients with more frequent lymphatic metastasis. (C) The expression of circ-104916 was lower in higher tumor-stage patients. **P<0.01.
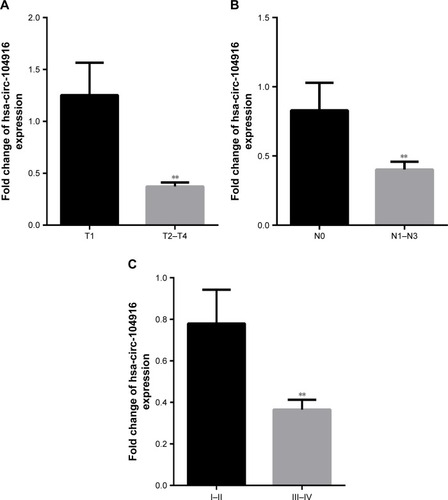
Table 1 Correlation with the clinicopathological data and expression of circ-104916
Figure 3 Circ-104916 overexpression suppressed the proliferation of GC cells.
Notes: (A) Circ-104916 was more downregulated in GC cell lines (BGC823, MGC803, MKN45, SGC7901, AGS) than in the normal gastric mucosa cell line (GES-1). (B) The effects of the pcDNA-hsa-circ-104916 plasmid on the expression of circ-104916 in GC cell lines. (C) Effect of circ-104916 on cell proliferation in vitro by CCK-8 assay. Error bars represent mean ± SEM from three independent experiments. **P<0.01.
Abbreviations: GC, gastric cancer; CCK-8, Cell Counting Kit-8; OD, optical density; SEM, standard error of the mean.
Abbreviations: GC, gastric cancer; CCK-8, Cell Counting Kit-8; OD, optical density; SEM, standard error of the mean.
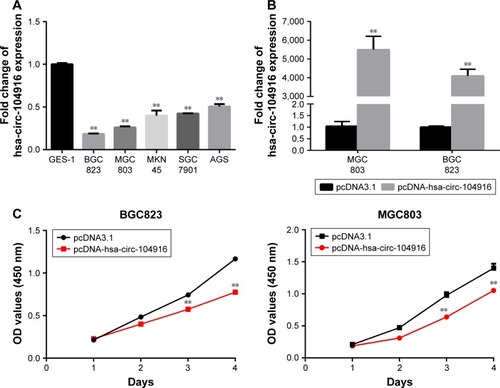
Figure 4 Circ-104916 inhibited the migration and invasion of GC cells.
Notes: (A) After transfecting pcDNA-hsa-circ-0067934, GC cells showed reduced migration in transwell migration assays. (B) Circ-104916 also suppressed the invasion ability of BGC823 and MGC803 cells. **P<0.01. (C) After transfecting pcDNA-hsa-circ-104916, the protein level of key molecules of EMT was assessed by Western blot.
Abbreviations: GC, gastric cancer; EMT, epithelial–mesenchymal transition.
Abbreviations: GC, gastric cancer; EMT, epithelial–mesenchymal transition.
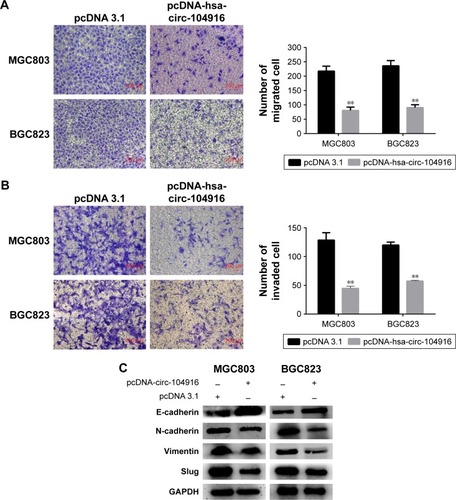
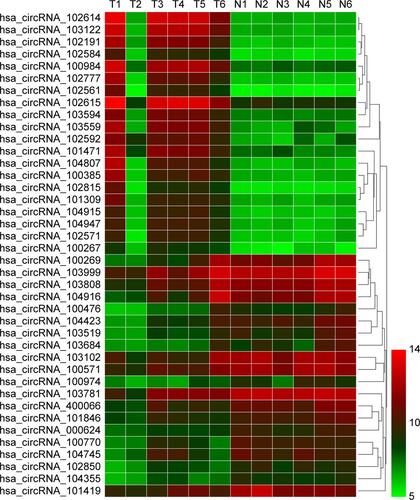
Figure S1 Hierarchical clustering analysis of the most up- and down regulated circRNAs.
Notes: Each column represents a sample, and each row represents a circRNA. Red strip represents a high relative expression, and green strip represents a low relative expression. T represents GC tissues and N represents normal gastric mucosa.
Abbreviation: GC, gastric cancer.