
Figures & data
Table 1 Clinical characteristics of patients with ENKTL, nasal type
Figure 1 Comparison of overall survival between the CCRT and SCRT groups (P=0.029).
Abbreviations: CCRT, concurrent chemoradiotherapy; SCRT, sequential chemotherapy followed by radiotherapy.
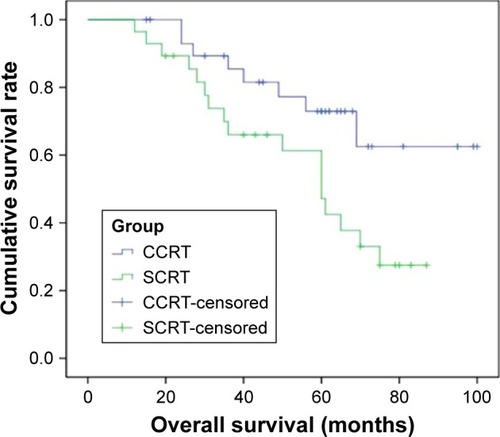
Figure 2 Comparison of progression-free survival between the CCRT and SCRT groups (P=0.030).
Abbreviations: CCRT, concurrent chemoradiotherapy; SCRT, sequential chemotherapy followed by radiotherapy.
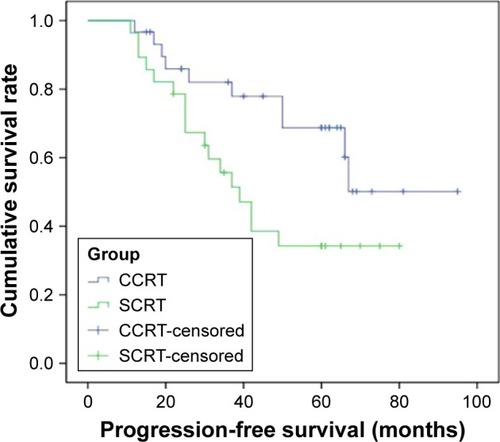
Figure 3 Comparison of locoregional-free survival between the CCRT and SCRT groups (P=0.026).
Abbreviations: CCRT, concurrent chemoradiotherapy; SCRT, sequential chemotherapy followed by radiotherapy.
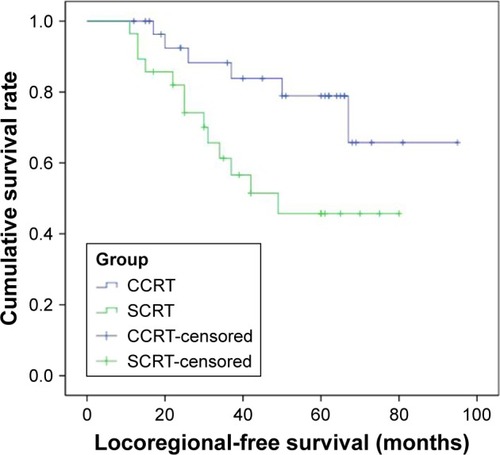
Table 2 Patterns of failure for CCRT and SCRT group patients
Table 3 Adverse event grade by treatment group