Figures & data
Figure 1 Profile of TPX2 expression in prostate cancer and human cancer cells.
Notes: The RNA sequence database was retrieved from TCGA website. (A) TPX2 mRNA expression was high in PRAD (T) and low in normal solid tissues (N). (B) TPX2 mRNA expression in prostate cancer was positively correlated with different Gleason scores (Pearson correlation coefficient analysis, R=0.046, P<0.001). (C) The cumulative survival curves between patients with high and low levels of TPX2 expression in PRAD (P=0.0055, log-rank test). (D) The cumulative survival curves for 467 patients with PRAD in relation to tumor Gleason scores (P=0.138, log-rank test). (E) TPX2 mRNA expression detected in prostate and breast cancer cell lines. The TPX2 mRNA levels were measured using an RT-PCR assay. For all assays, TPX2 was at 32 cycles; RPS26 was amplified at 22 cycles as an internal control. (F) TPX2 expression level in four PRAD specimens, determined using immunohistochemistry. The tumor cells exhibited strong TPX2 protein expression in case #1 and #2 tissue sections and weak TPX2 protein expression in case #3 and #4 tissue sections, but no immunoreactivity was observed for TPX2 protein in adjacent nontumor cells. Scale bar =50 mm; magnification 400×.
Abbreviations: Breast ca., breast cancer; PRAD, prostate adenocarcinoma; Prostate ca., prostate cancer; RT-PCR, reverse transcription-polymerase chain reaction; TCGA, The Cancer Genome Atlas; H, TPX2 high expression; L, TPX2 low expression.
Abbreviations: Breast ca., breast cancer; PRAD, prostate adenocarcinoma; Prostate ca., prostate cancer; RT-PCR, reverse transcription-polymerase chain reaction; TCGA, The Cancer Genome Atlas; H, TPX2 high expression; L, TPX2 low expression.
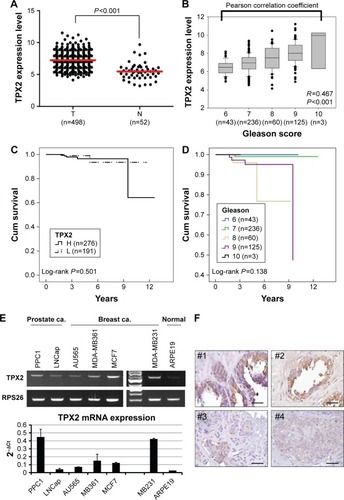
Figure 2 Inhibition of cell growth and reduction of tumorigenesis in human prostate cancer cell lines via TPX2 silencing.
Notes: Scrambled siRNA (20 nM, si-CTL) or the siRNA oligos pool against TPX2 (20 nM, si-TPX2) was transfected into human prostate cancer cells (PPC1) for 72 h. (A) Cells were harvested and lysed for immunoblotting to determine the protein levels of TPX2. β-actin was used as a loading control. Protein expression was quantified by densitometric analysis. The ratios (TPX2/β-actin) of band intensities are shown. (B) Cell viability was measured using the CellTiter-Glo Luminescent Cell Viability Assay, and the luminescence units indicating cell growth were measured and plotted as the growth curve. (*The cell growth was inhibition in si-TPX2 treated cells compared with si-CTL treated cells). (C) Representative data and quantitative results of siRNA-transfected cells that were seeded in six-well plates for the clonogenic assay. (D) Representative data and quantitative results of siRNA-transfected cells that were seeded in ultralow attachment 96-well microplates for spheroid formation assays. All representative graphs are from three independent experiments. Values are presented as mean ± SD (Student’s t-test, P<0.05 was considered significant).
Abbreviation: si-CTL, small interfering negative control.
Abbreviation: si-CTL, small interfering negative control.
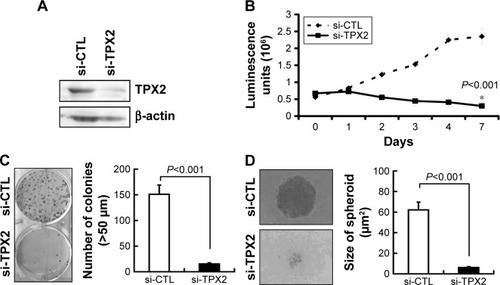
Figure 3 Increase of sub-G1 and reduction of G1 to S phase cells via TPX2 silencing.
Notes: (A) PPC1 cells were synchronized by double thymidine and nocodazol (Thy–Thy–Noc) block or double thymidine (Thy–Thy) block and then released for the indicated time period. The phase of cell fracture during cell cycle progression was monitored through protein expression evolution. Cyclin B1 indicated G2/M phase progression, and cyclin A indicated S to G2/M phase progression. TPX2 protein levels were measured using a Western blot assay. (B) Scrambled siRNA (20 nM, si-CTL) or the siRNA oligos pool against TPX2 (20 nM, si-TPX2) was transfected into PPC1 cells for 72 h, followed by cell harvesting. The knockdown cells were fixed and stained with DAPI to examine the proportions of the cell cycle by using an image-flow cytometry assay. (C) Representative data for cell cycle proportions were analyzed and quantified using Nucleoview NC-3000 software. The results are expressed as mean ± SD from three individual experiments (Student’s t-test, P<0.05 was considered significant).
Abbreviations: DAPI, 4′,6-diamidino-2-phenylindole; Noc, nocodazol; si-CTL, small interference-negative control; Thy, thymidine.
Abbreviations: DAPI, 4′,6-diamidino-2-phenylindole; Noc, nocodazol; si-CTL, small interference-negative control; Thy, thymidine.
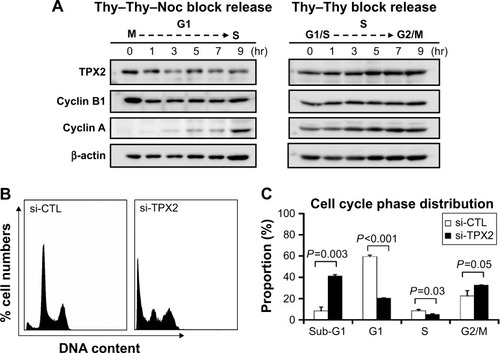
Figure 4 PPC1 cell apoptosis caused by TPX2 silencing.
Notes: Annexin V expression analysis was used for apoptosis cell detection. (A) Representative images of scrambled siRNA (20 nM, si-CTL) or the siRNA oligos pool against TPX2 (20 nM, si-TPX2) that was transfected into PPC1 cells for 72 h, followed by cell staining with annexin V (green) and Hoechst 33342 (nucleus; blue) for the immunofluorescence assay. Notably, annexin V was increased in the si-TPX2–treated cells. Scale bar =50 mm; magnification 200×. (B) Quantitative results of annexin V-positive staining cell. Values are presented as mean ± SD (Student’s t-test, P<0.05 was considered significant). (C) siRNA-transfected PPC1 cells were stained with annexin V and PI without fixing. The proportions of the annexin V-positive staining cells were examined using an image-flow cytometry assay. The lower right quadrant (red box) indicates the annexin V-positive (early apoptosis) cells, and the quantitative frequency data are shown below the box.
Abbreviations: annexin V(+), annexin V positive; PI, propidium iodide; si-CTL, small interference-negative control; BMP, a image format of windows bitmap.
Abbreviations: annexin V(+), annexin V positive; PI, propidium iodide; si-CTL, small interference-negative control; BMP, a image format of windows bitmap.
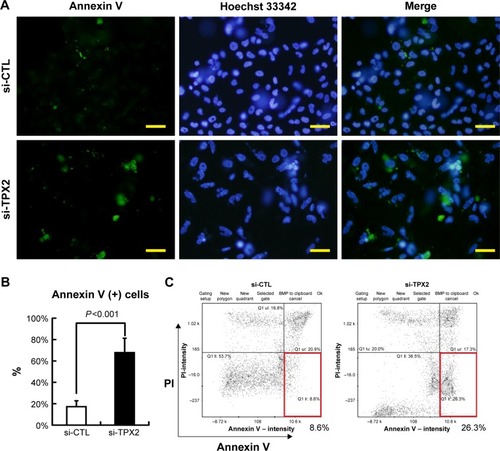
Figure 5 Depletion of TPX2, as reflected by changes in cell cycle regulation.
Notes: (A) Graphical representation of a heat map showing fourfold gene expression changes in TPX2-depleted PPC1 cells. (B) Scatter plot analysis of gene expression changes; specifically, 1 gene was upregulated (red circle) and 15 genes were downregulated (green circles). (C) Fold change of normalized expression between scrambled siRNA and the siRNA oligo pool-transfected PPC1 cells that were analyzed using pathway-focused validated qPCR arrays; notably, downregulation of genes is associated with cell cycle progression and proliferation in conjunction with the upregulation of growth inhibitory genes.
Abbreviations: qPCR, quantitative polymerase chain reaction; si-CTL, small interference-negative control.
Abbreviations: qPCR, quantitative polymerase chain reaction; si-CTL, small interference-negative control.
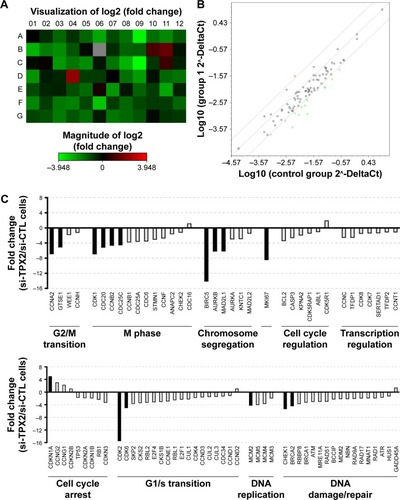
Figure 6 Increase in genomic instability via TPX2 depletion, resulting in micronucleation and DNA damage in PPC1 cells.
Notes: (A) Representative images of TPX2 and α-tubulin immunofluorescence in TPX2-depleted PPC1 cells. TPX2 expression was decreased in si-TPX2 treated cells, and morphologic examination of the cell nucleus (DAPI stain) revealed that transfection with the TPX2 RNAi oligo pool resulted in increased micronucleated cells (arrows). Scale bar =50 mm; magnification 400×. (B) Histograms of micronucleation in PPC1 cells. (C) Western blot analysis of the levels of TPX2, cyclin D1, CDK4, CDK6, P21, cyclin A, CDK1, securin, separase, cyclin B1, B2, aurora A, and aurora B proteins in TPX2-targeted cells. β-actin was used as a loading control.
Abbreviations: CDK, cyclin-dependent kinase; DAPI, 4′,6-diamidino-2-phenylindole; si-CTL, small interference-negative control.
Abbreviations: CDK, cyclin-dependent kinase; DAPI, 4′,6-diamidino-2-phenylindole; si-CTL, small interference-negative control.
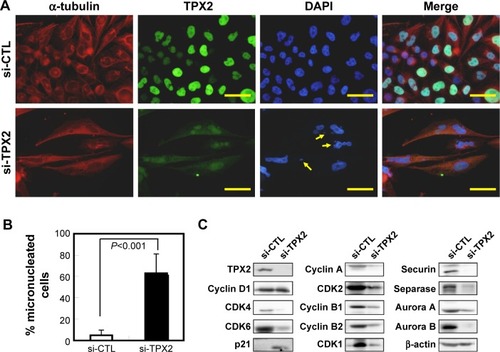
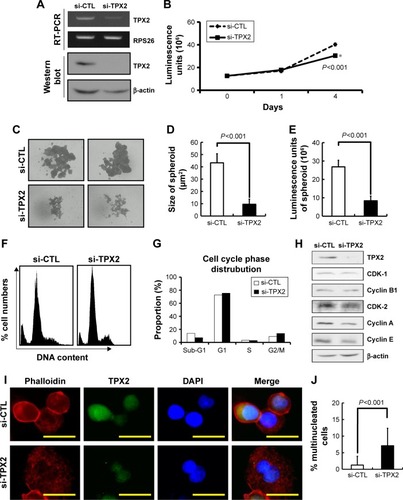
Figure 7 TPX2 depletion changes the cell fitness in LNCap prostate cancer cell line.
Notes: Scrambled siRNA (20 nM, si-CTL) or the siRNA oligos pool against TPX2 (20 nM, si-TPX2) was transfected into LNCap human prostate cancer cells for 96 h. (A) RT-PCR was used to detect the mRNA levels of TPX2 in LNCap cells. siRNA-transfected cells were harvested and lysed for immunoblotting to determine the protein levels of TPX2. β-actin was used as a loading control. Protein expression was quantified by densitometric analysis. (B) Cell viability was measured using the CellTiter-Glo Luminescent Cell Viability Assay, and the luminescence units indicating cell growth were measured and plotted as the growth curve. (*The cell growth was inhibition in si-TPX2 treated cells compared with si-CTL treated cells). (C) Representative data and (D) quantitative results of siRNA-transfected cells that were seeded in ultralow attachment 96-well microplates for spheroid formation assays by using ImageJ software. (E) LNCap spheroids presented irregular morphology; hence, viable cells were measured using the CellTiter-Glo Luminescent Cell Viability Assay, and the luminescence units indicating cell growth were measured and plotted as the bar plot. (F) Scrambled siRNA (20 nM, si-CTL) or the siRNA oligos pool against TPX2 (20 nM, si-TPX2) was transfected into LNCap cells for 72 h, followed by cell harvesting. The knockdown cells were fixed and stained with DAPI to examine the proportions of the cell cycle by using an image-flow cytometry assay. (G) Representative data for cell cycle proportions were analyzed and quantified using Nucleoview NC-3000 software. (H) Western blot analysis of the levels of TPX2, CDK1, cyclin B1, CDK2, cyclin A, and cyclin E proteins in TPX2-targeted cells. β-actin was used as a loading control. (I) Representative images of TPX2 and Phalloidin (a high-affinity F-actin probe conjugated to the red-orange fluorescent dye, tetramethylrhodamine) immunofluorescence in TPX2-depleted LNCap cells. TPX2 expression was decreased in si-TPX2 treated cells, and morphologic examination of the cell nucleus (DAPI stain) revealed that transfection with the TPX2 RNAi oligo pool resulted in increased multinucleated cells. Scale bar =25 mm; magnification 400×. (J) Histograms of multinucleation in LNCap cells. All representative graphs are from two independent experiments. Values are presented as mean ± SD (Student’s t-test, P<0.05 was considered significant).
Abbreviations: CDK, cyclin-dependent kinase; DAPI, 4′,6-diamidino-2-phenylindole; si-CTL, small interference-negative control.
Abbreviations: CDK, cyclin-dependent kinase; DAPI, 4′,6-diamidino-2-phenylindole; si-CTL, small interference-negative control.