
Figures & data
Figure 1 Selection of the included studies.
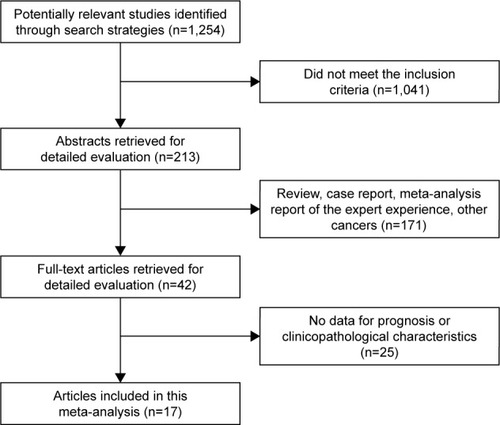
Table 1 Basic characteristics of the retrieved studies
Table 2 The assessment of the risk of bias in each cohort study using the NOS
Figure 2 Meta-analysis of clinicopathological characteristics, (A) tumor infiltration, (B) node metastasis, (C) TNM stage, (D) pathological grade, (E) age and (F) sex.
Abbreviations: TNM, tumor–node–metastasis; RR, risk ratio; CI, confidence interval.
Note: Weights are from random effective analysis.
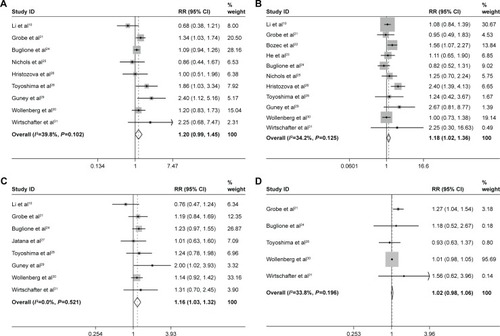
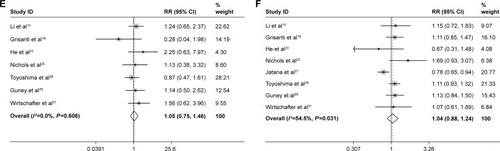
Figure 3 Meta-analysis of prognostic value, (A) OS, (B) DFS, (C) PFS and (D) recurrence.
Note: Weights are from random effective analysis.
Abbreviations: OS, overall survival; DFS, disease-free survival; PFS, progression-free survival; HR, hazard ratio; CI, confidence interval; RR, risk ratio.
Abbreviations: OS, overall survival; DFS, disease-free survival; PFS, progression-free survival; HR, hazard ratio; CI, confidence interval; RR, risk ratio.
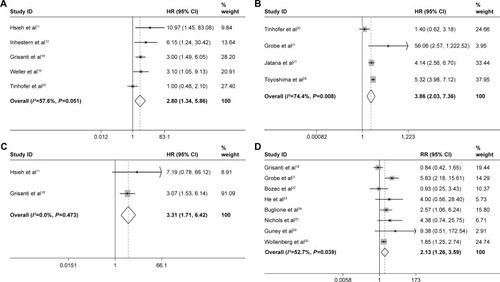
Figure 4 Sensitivity analysis for the pooled prognostic value, (A) OS, (B) DFS, and (C) recurrence.
Abbreviations: OS, overall survival; DFS, disease-free survival; CI, confidence interval.
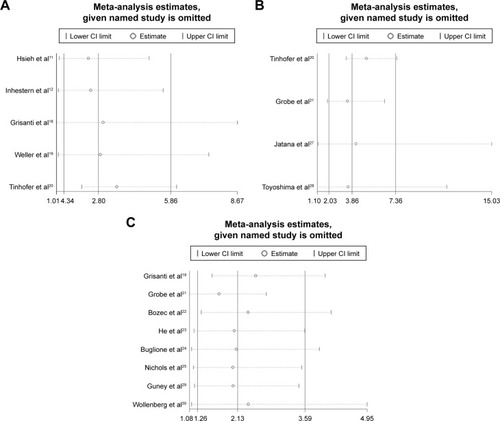
Table 3 Publication bias by Egger’s and Begg’s test