
Figures & data
Figure 1 FGF2 expression in human uveal melanoma tissue samples. (A) Representative images of negative FGF2 expression in a spindle cell subtype sample and positive FGF2 expression in an epithelioid subtype sample (immunohistochemical staining, 100×); (B) FGF2 expression was higher in lung metastatic foci than in the primary foci from the same patient (immunohistochemical staining, 100×).
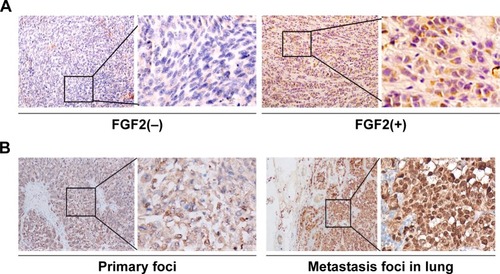
Table 1 Correlation between FGF2 and clinicopathologic characteristics of uveal melanoma
Figure 2 The effect of FGF2 on intracellular Ca2+ concentration and expression of store-operated calcium entry-regulated proteins. (A) FGF2 stimulation elevated intracellular calcium concentration, and 2-APB reversed this effect (left); (B) FGF2 stimulation increased the expression of STIM1 and ORAI1 of MUM2B cells, and 2-APB reversed this effect (left). Relative amounts of protein expression of STIM1 and ORAI1 compared with β-actin (right) (*P<0.05 between FGF2-treated cells and the control cells, **P<0.05 between FGF2/2-APB-treated cells and the FGF2-treated cells).
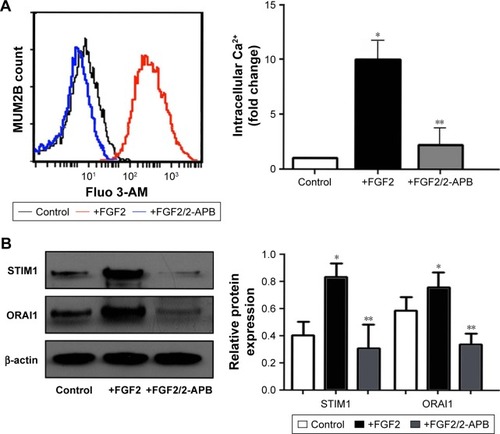
Figure 3 2-APB impairs increased horizontal and vertical migration and decreased adhesion of MUM2B cells caused by FGF2. (A) Images of wound healing assay at 0, 12, and 24 h (100×) (left). Migration distances at different times in the wound healing assay (right); (B) Cells invading through the Boyden chamber were stained (200×) (left). The numbers of invading cells were counted in five predetermined fields (right); (C) The numbers of bound cells were counted in five high magnification (200×) fields (*P<0.05 between FGF2-treated cells and the control cells, **P<0.05 between FGF2/2-APB-treated cells and the FGF2-treated cells).
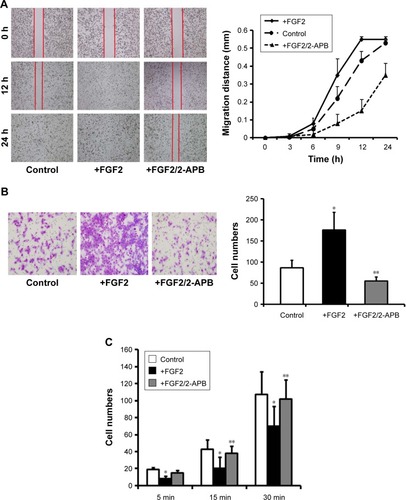
Figure 4 2-APB impairs cytoskeleton assembly of MUM2B cells caused by FGF2. (Immunofluorescent staining of F-actin, Scale bar: 50 μm).
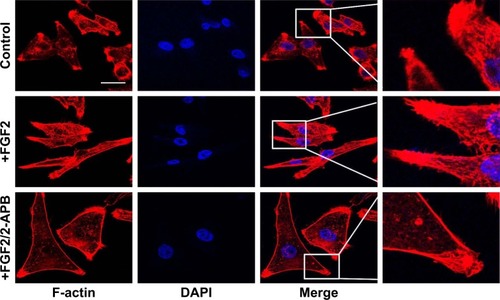
Figure 5 2-APB inhibits in vivo tumor growth, metastasis caused by FGF2 and decreases the expression of STIM1 and ORAI1 in a MUM2B xenograft mouse model. (A) Xenograft tumor volumes are monitored over time (upper). Representative xenograft tumors on Day 30 post injection (lower); (B) Mice injected with cells with FGF2 stimulation showed lung metastasis and vascular invasion (H&E staining, 200×); (C) Representative images of the expression of FGF2, STIM1, and ORAI1 in xenograft tumor tissues (immunohistochemical staining, 400×).
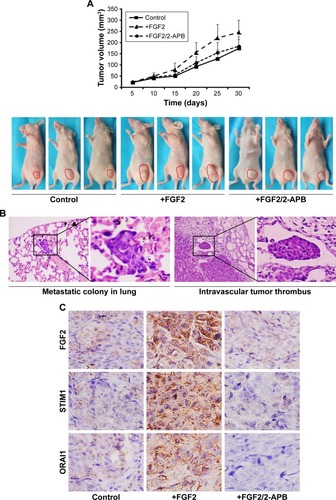
Figure 6 FGF2 expression was concomitant with the expression of STIM1 and ORAI1 in human uveal melanoma tissue samples. Representative images of the expression of FGF2, STIM1, and ORAI1 in FGF2-negative and -positive groups (immunohistochemical staining, 200×) (left). Percentages of STIM1 or ORAI1 negative and positive expression in the FGF2-negative and FGF2-positive groups (right).
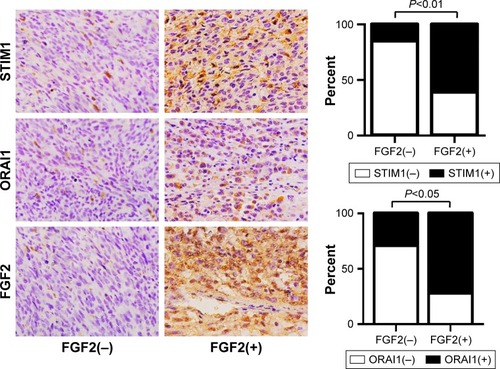
Table 2 Correlation between expression of FGF2 and ORAI1, STIM1