
Figures & data
Figure 1 Expressions of p53 mRNA in (A) MUM-2B, C918, and (B) D78 cells as detected by RT-PCR.
Abbreviations: mRNA, messenger RNA; RT-PCR, real-time polymerase chain reaction.
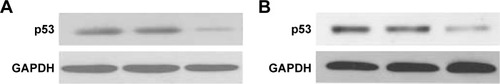
Table 1 RT-PCR primer sequence and silence sequence
Figure 2 Expression of p53 protein in MUM-2B, C918, and D78 cells as detected by Western blot.
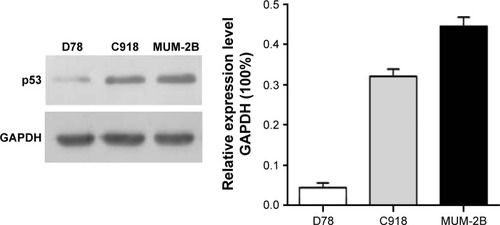
Figure 3 Expression of p53 protein in pathological tissues as detected by immunohistochemistry method (400×).
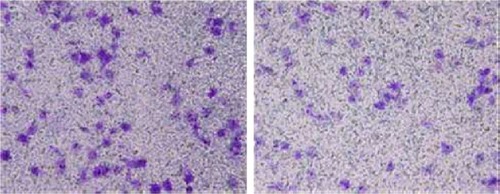
Figure 4 The cell invasion ability was measured by a transwell assay at 48 hours after p53 overexpression in cells.
Note: Magnification ×200.
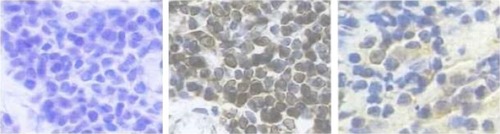
Table 2 Expression of p53 protein in normal tissues and uveal melanoma tissues
Table 3 Basic information of follow-up patients
Table 4 Comparison between p53 expression and the operational prognosis