
Figures & data
Table 1 Characteristics of the GEO datasets included in the meta-analysis
Figure 1 Forest plot of 27 GEO datasets evaluating the SMD of MALAT1 in the PC group and the healthy control group (a fixed-effect model).
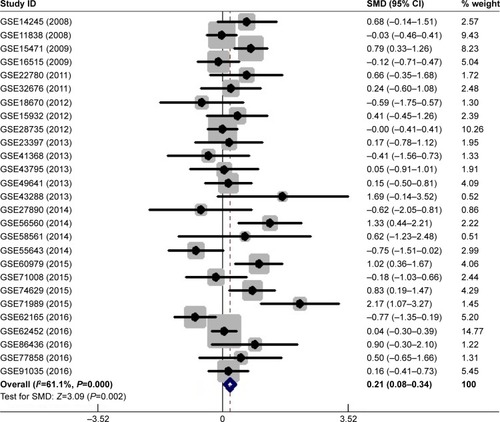
Figure 2 Sensitivity analysis to evaluate the heterogeneity among 27 GEO datasets.
Abbreviations: CI, confidence interval; GEO, Gene Expression Omnibus.
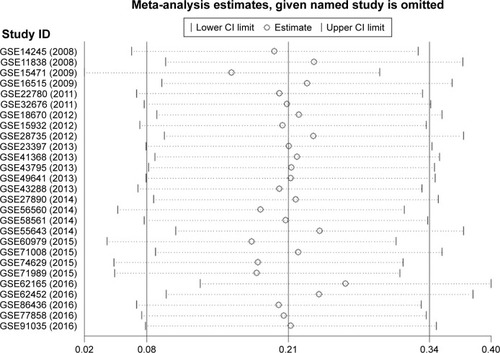
Figure 3 Forest plot of 25 GEO datasets evaluating the SMD of MALAT1 in the PC group and the healthy control group after omitting two datasets (GSE15471 and GSE62165) (a fixed-effect model).
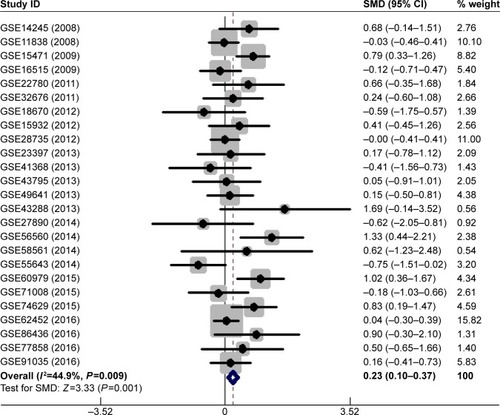
Figure 4 Begg’s funnel plot evaluating the publication bias among the 25 datasets.
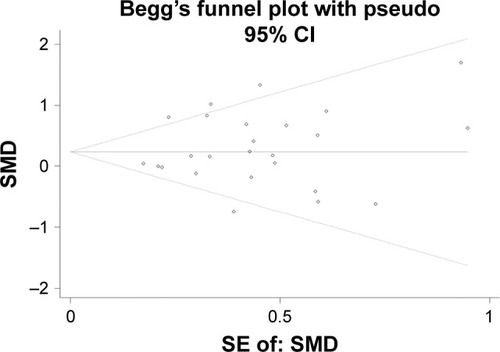
Figure 5 Summary of the ROC curve of 25 datasets evaluating the diagnostic value of MALAT1 in PC.
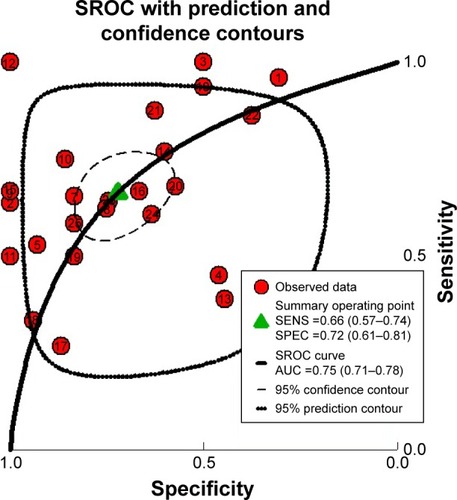
Figure 6 Forest plot of 25 datasets evaluating the diagnostic value of MALAT1 in PC.
Abbreviations: OR, odds ratio; PC, pancreatic cancer.
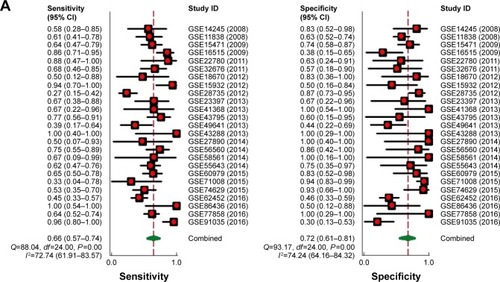
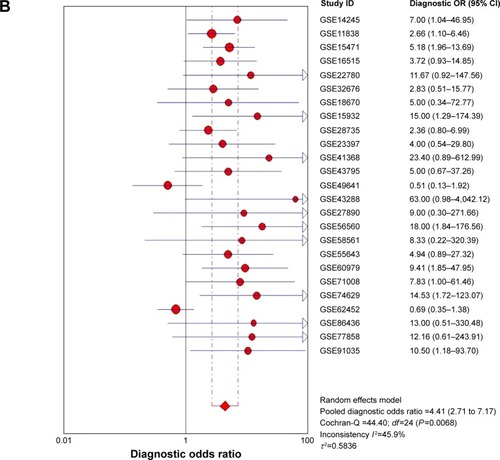
Figure 7 Box plot validating the expression of MALAT1 in the PC group and the healthy control group based on the Oncomine database.
Abbreviation: PC, pancreatic cancer.
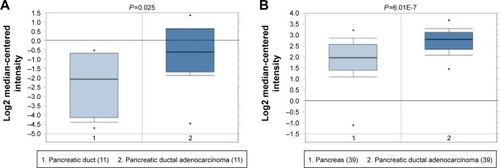
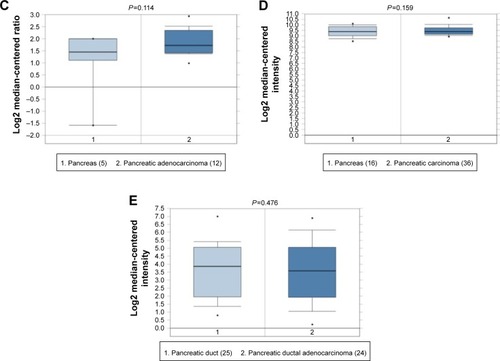
Figure 8 Survival analysis evaluating the prognostic value of MALAT1 in PC.
Abbreviation: PC, pancreatic cancer.
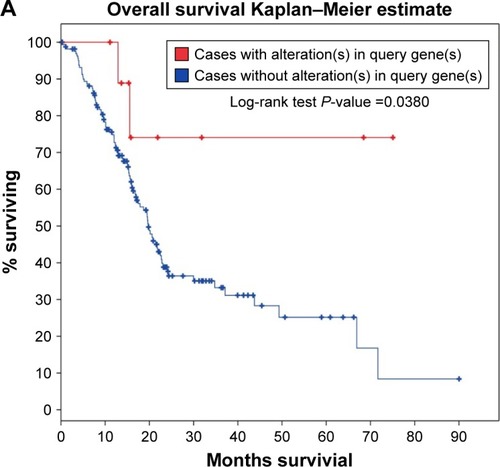
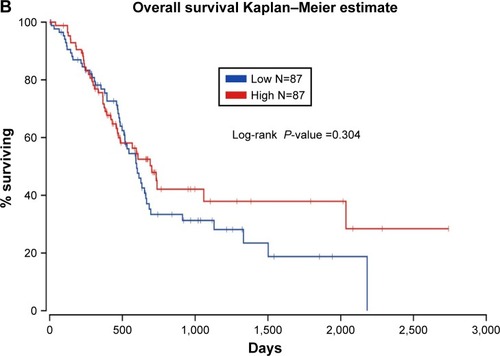
Figure 9 Significant MF network constructed by Cytoscape 3.40.
Abbreviations: GO, Gene Ontology; MF, molecular function.
Figure 10 Hub genes obtained from the PPI network.
Abbreviation: PPI, protein–protein interaction.
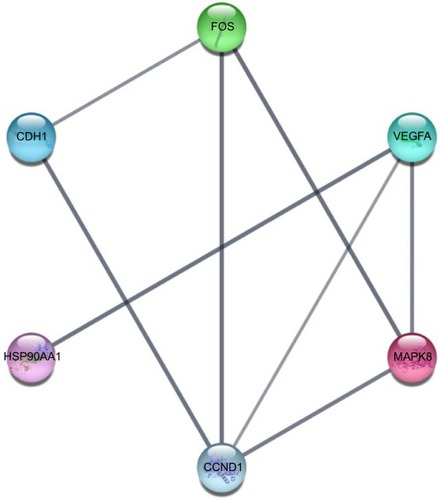
Table 2 Significant GO and KEGG items of the overlapping genes