
Figures & data
Figure 1 Stages of the systematic review of the trials.
Abbreviation: RCT, randomized controlled trial.
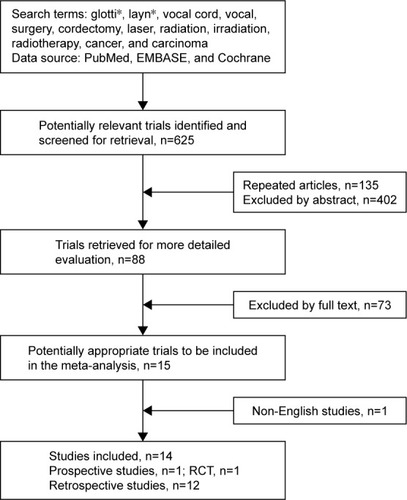
Table 1 Characteristics and demographics of included studies
Table 2 VHI of the two treatment groups in the included studies
Table 3 Acoustic analysis of the two treatment groups in the included studies
Figure 2 Forest plots of Voice Handicap Index (VHI).
Notes: The random-effects meta-analysis model (Mantel–Haenszel method) was used in this analysis. This is presented graphically as a black diamond, where the center of the diamond is the overall estimate and the width of the diamond is the overall confidence interval; the size of the green squares denotes the weight given to the study, with larger squares reflecting more weight.
Abbreviations: CI, confidence interval; IV, inverse variance; LS, laser surgery; RT, radiotherapy; SD, standard deviation.
Abbreviations: CI, confidence interval; IV, inverse variance; LS, laser surgery; RT, radiotherapy; SD, standard deviation.
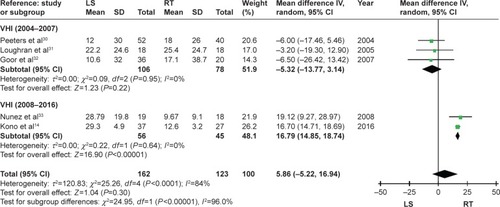
Figure 3 Forest plots of acoustic analysis outcomes.
Notes: Forest plots of (A) MPT, (B) F0, (C) Jitter, (D) Shimmer, and (E) AFR. The random-effects meta-analysis model (Mantel–Haenszel method) was used in this analysis. This is presented graphically as a black diamond, where the center of the diamond is the overall estimate and the width of the diamond is the overall confidence interval; the size of the green squares denotes the weight given to the study, with larger squares reflecting more weight.
Abbreviations: AFR, air flow rate; CI, confidence interval; F0, fundamental frequency; IV, inverse variance; LS, laser surgery; MPT, maximum phonation time; RT, radiotherapy; SD, standard deviation.
Abbreviations: AFR, air flow rate; CI, confidence interval; F0, fundamental frequency; IV, inverse variance; LS, laser surgery; MPT, maximum phonation time; RT, radiotherapy; SD, standard deviation.
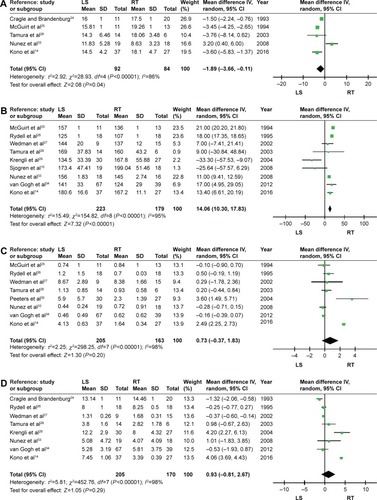
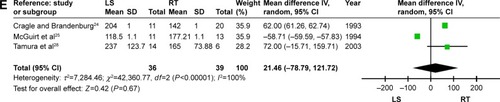
Figure 4 Publication bias: funnel plots of F0.
Abbreviations: F0, fundamental frequency; MD, mean difference; SE, standard error.
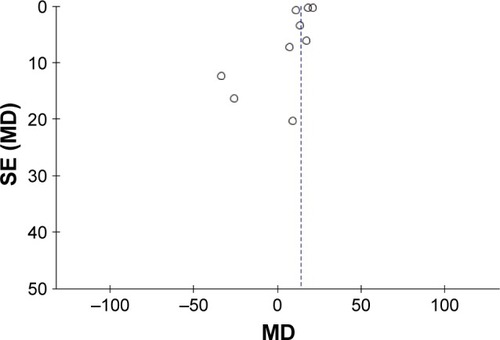
Table 4 Summary statistics of pooled data comparing LS versus RT