
Figures & data
Table 1A Common condition of 2 groups (n, years)
Table 1B Tumor size of 2 groups (cm, cm3)
Table 2 Hepatic function changes pre- and 7 days postoperation (paired-samples t-test)
Table 3 Coagulation of 2 groups pre- and postoperation
Table 4 Biomarkers of two groups pre- and postoperation
Figure 1 One male patient with HCC, the necrosis range of PMCT after TACE did not enlarged.
Abbreviations: PMCT, percutaneous microwave coagulation therapy; TACE, transarterial chemoembolization.
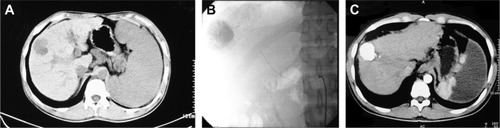
Figure 2 One month after PMCT only, the necrosis area surrounded the tumor area completely (CT CE).
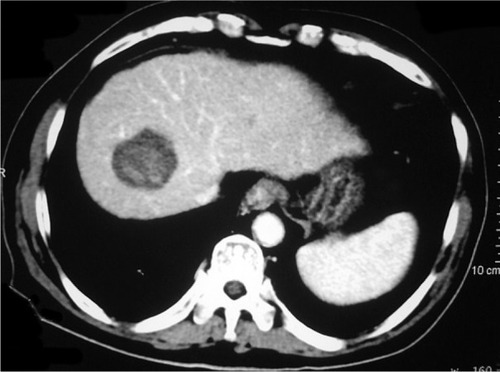
Figure 3 (A) One and a half months later, CT image showed that the heating area spread to the opposite direction of the surface liver because of the obstruction in the lipiodol deposition (CT CE axial). (B) One a and a half months later, the same case of (A), CT image showed that the heating area spread to the opposite direction of the liver surface (CT CE, coronal).
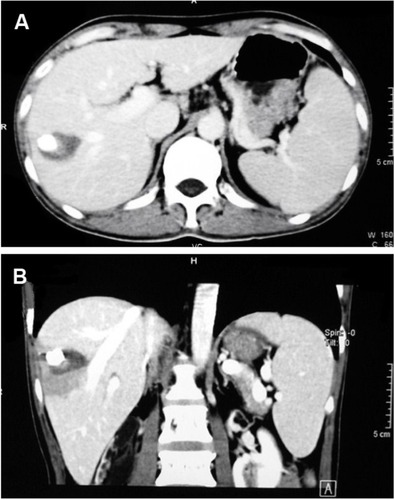
Table 5 Tumor size and necrosis volume of PMCT of 2 groups (cm, cm3)
Table 6 Necrosis range of 2 groups after PMCT (cm, cm3)
Table 7 Necrosis range of 2 groups after PMCT and ideal necrosis range (cm, cm3)