Figures & data
Figure 1 The experimental design of the paper.
Abbreviations: BC, bladder cancer; GO, gene ontology; GEO, Gene expression Omnibus; PPI, protein-protein interaction; KEGG, Kyoto Encyclopedia of Genes and Genomes.
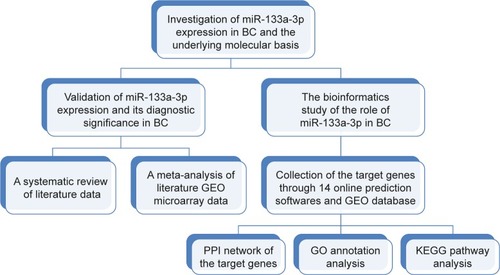
Figure 2 The flow chart.
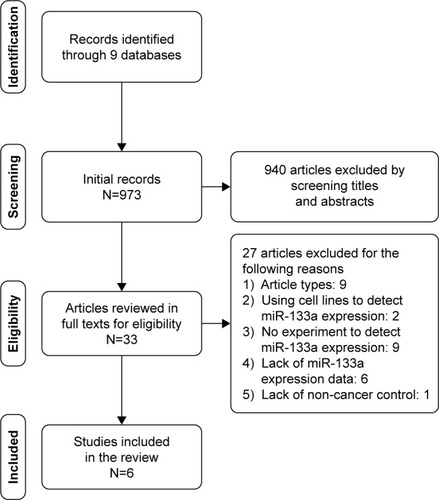
Table 1 The basic information and data of the included studies
Figure 3 The pattern of miR-133a-3p expression in BC tissues and normal tissues.
Abbreviation: BC, bladder cancer.
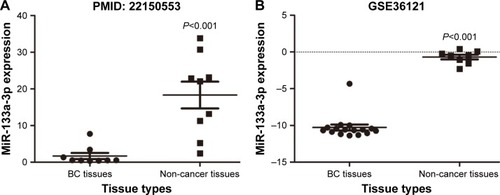
Figure 4 The forest plot of meta-analysis.
Abbreviations: SMD, standard mean difference; BC, bladder cancer; 95% CI, 95% confidence interval.
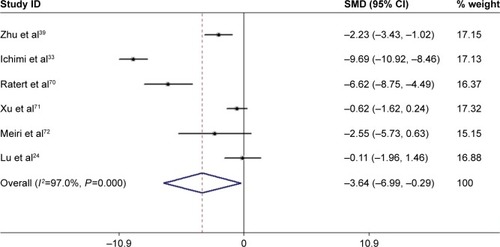
Figure 5 The sensitivity analysis.
Abbreviation: CI, confidence interval.
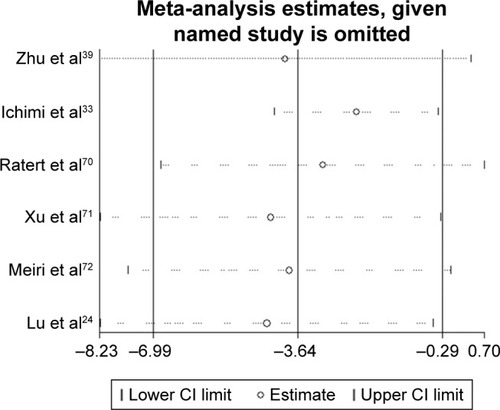
Figure 6 The publication bias.
Abbreviation: SMD, standard mean difference.
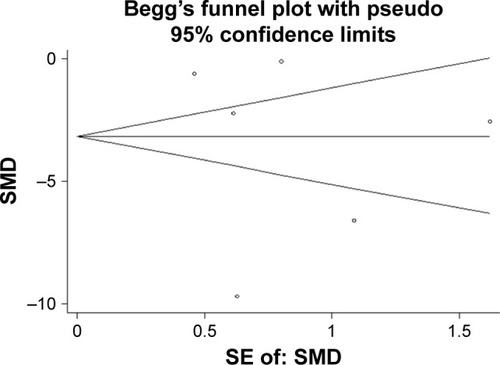
Figure 7 The SROC curve.
Abbreviations: SROC, summary receiver operating characteristic; AUC, area under curve; BC, bladder cancer.
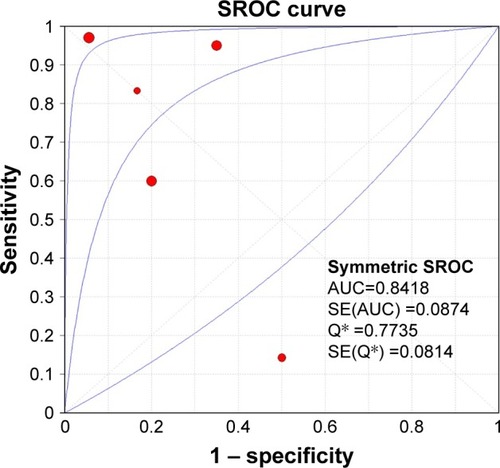
Table 2 Subgroup analysis
Figure 8 The PPI network of the target genes of miR-133a-3p.
Abbreviation: PPI, protein-protein network.
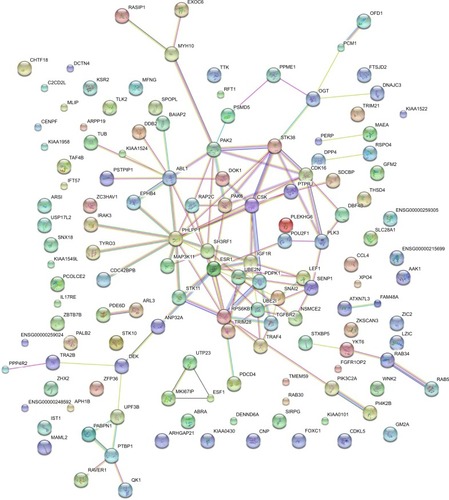
Figure 9 Expression of hub genes in BC and normal tissues from GEPIA.
Abbreviations: BC, bladder cancer; GEPIA, Gene Expression Profiling Interactive Analysis.
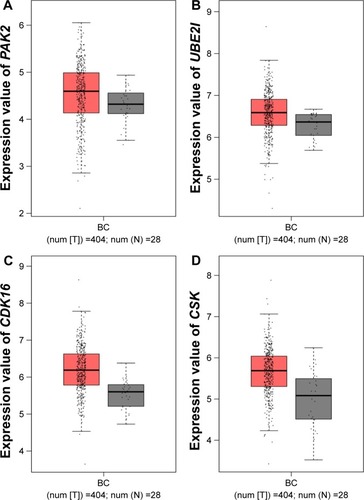
Table 3 GO enrichment analysis of the target genes of miR-133a-3p
Table 4 KEGG pathway analysis of the target genes of miR-133a-3p
Figure S1 The GO maps for BP of target genes of miR-133a-3p.
Notes: There are 69 nodes and 101 arrows in the map. GO terms of BP are represented by nodes, and the relationships between the terms are manifested by arrows. The depth of color indicates the significance of the corresponding term.
Abbreviations: GO, Gene Ontology; BP, biological process.
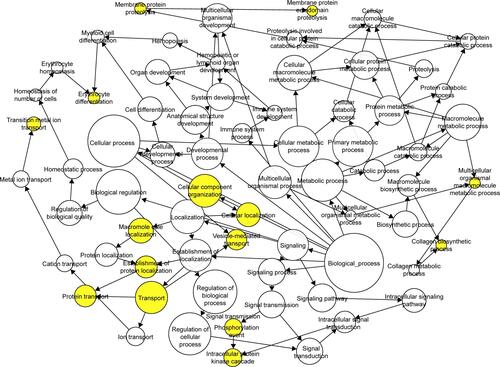
Figure S2 The GO maps for CC of target genes of miR-133a-3p.
Notes: There are 75 nodes and 130 arrows in the map. GO terms of CC are represented by nodes, and the relationships between the terms are manifested by arrows. The depth of color indicates the significance of the corresponding term.
Abbreviations: GO, Gene Ontology; CC, cellular component.
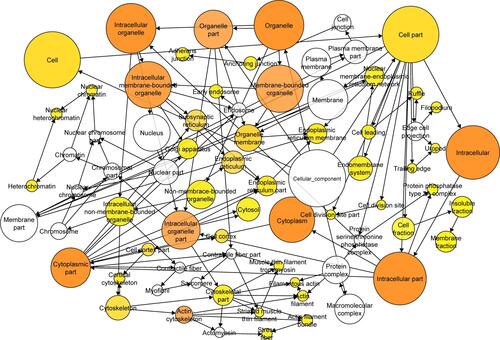
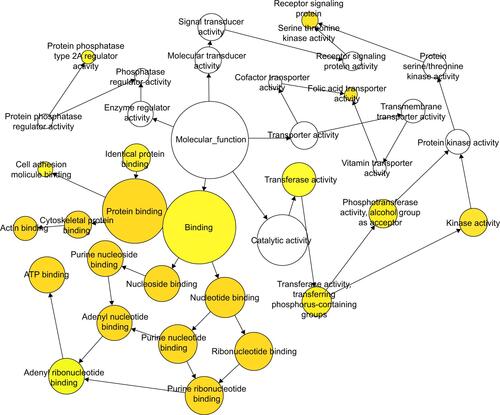
Figure S3 The GO maps for MF of target genes of miR-133a-3p.
Notes: There are 36 nodes and 41 arrows in the map. GO terms of MF are represented by nodes, and the relationships between the terms are manifested by arrows. The depth of color indicates the significance of the corresponding term.
Abbreviations: GO, Gene Ontology; MF, molecular functions.