
Figures & data
Figure 1 Search flow diagram for the meta-analysis.
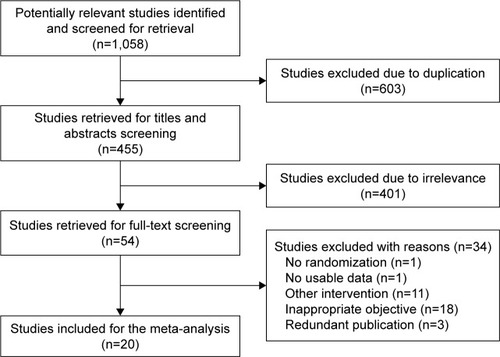
Table 1 Description of baseline characteristics included trials
Figure 2 Forest plot comparing response rate between modified RT and conventional RT.
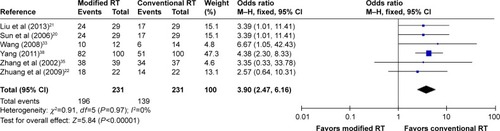
Figure 3 Forest plots comparing survival rate between modified RT and conventional RT: (A) 1-year survival; (B) 3-year survival; (C) 5-year survival.
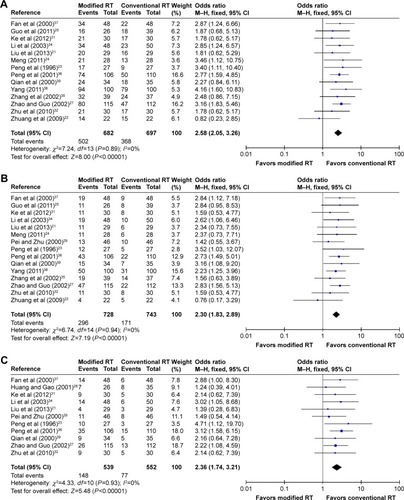
Figure 4 Forest plots comparing local control rate between modified RT and conventional RT: (A) 1-year local control; (B) 3-year local control; (C) 5-year local control.
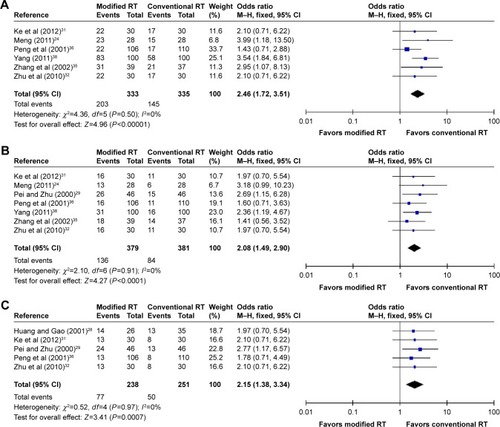
Figure 5 Forest plots comparing acute radiation reactions between modified RT and conventional RT: (A) acute radiation esophagitis; (B) acute radiation tracheitis.
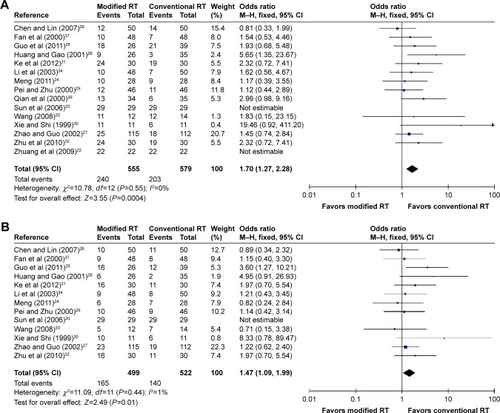
Figure 6 Forest plots comparing early adverse reactions between modified RT and conventional RT: (A) esophageal perforation; (B) esophagorrhagia.
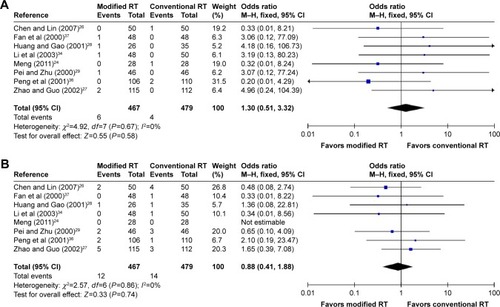
Table 2 Publication biases assessment of this meta-analysis