Figures & data
Table 1 List of primers and their sequences used in this study
Figure 1 Downregulation of both SDPR-AS and SDPR expression in RCC tissue samples.
Abbreviations: SDPR, serum deprivation response; SDPR-AS, antisense (AS) transcript of SDPR; RCC, renal cell carcinoma; TNM, tumor node metastasis.
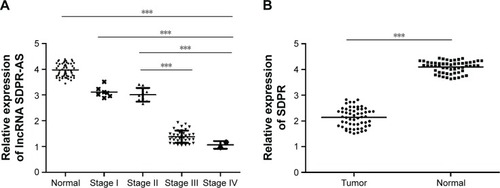
Figure 2 Expressions of SDPR-AS and SDPR are positively correlated.
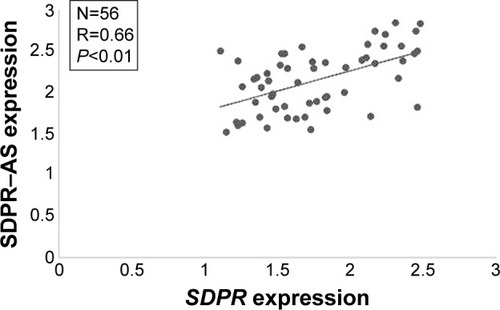
Figure 3 SDPR expression was co-regulated with SDPR-AS overexpression or knockdown in RCC cell lines.
Abbreviations: SDPR, serum deprivation response; SDPR-AS, antisense (AS) transcript of SDPR; NC, negative control; pc, plasmid complementary; HKC, renal tubular cell.
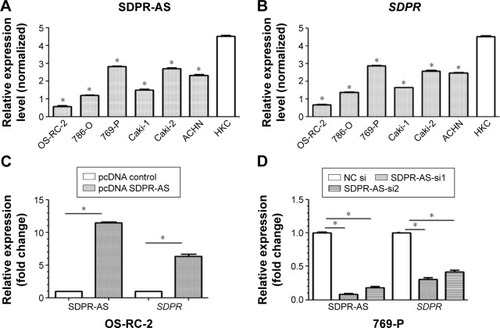
Figure 4 Overexpression of SDPR-AS suppressed the migration and invasion of OS-RC-2 cell line but had no evident association with proliferation.
Abbreviations: pc, plasmid complementary; SDPR, serum deprivation response; SDPR-AS, antisense (AS) transcript of SDPR.
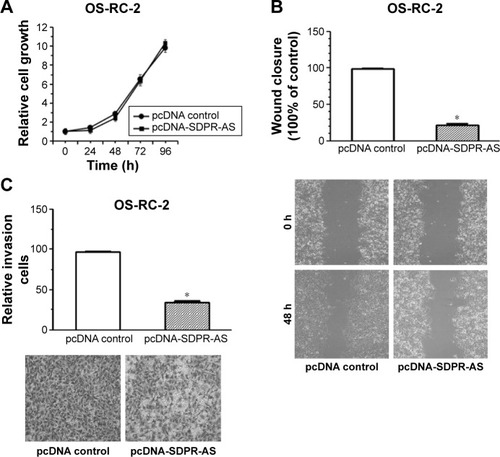
Figure 5 Knockdown of SDPR-AS promoted the migration and invasion of 769-P cell line but showed no evident association with proliferation.
Abbreviations: NC, negative control; SDPR, serum deprivation response; SDPR-AS, antisense (AS) transcript of SDPR.
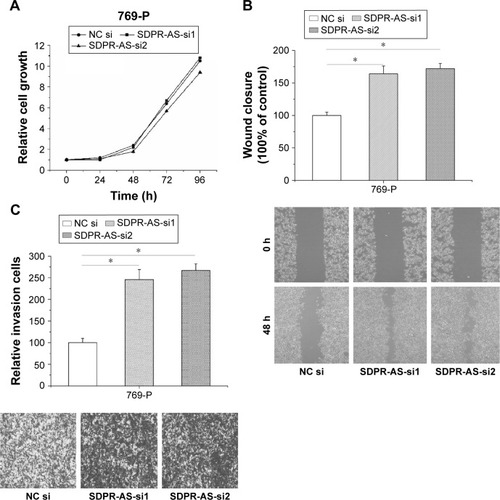
Table 2 Correlation between SDPR-AS expression and clinicopathologic features of RCC patients
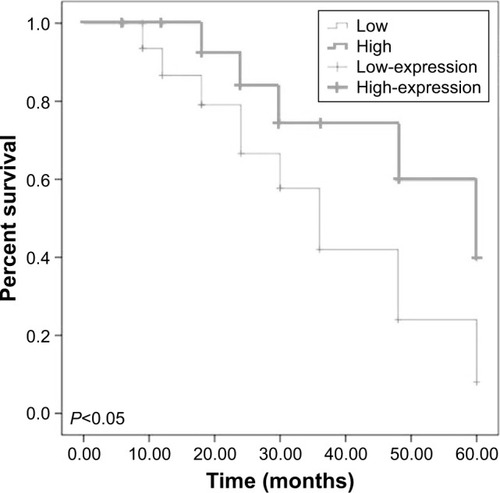
Figure 6 The association between SDPR-AS expression and prognosis of RCC patients.