
Figures & data
Table 1 Treatment regimens
Figure 1 Detection of gene polymorphisms in UGT1A1*6 and UGT1A1*28 quality control genes by DFMH.
Notes:
UGT1A1 gene polymorphisms were detected using different fluorescent probes specific for UGT1A1*6 or UGT1A1*28 wild-type or mutant genotypes. The time to reach the specific fluorescence ST was determined for each channel using the fluorescence detector software, Microseq (Tianlong Science and Technology Co., Ltd., Xi’an, China). ΔST was calculated to set the range of ΔST values indicative of each UGT1A1 polymorphism, which could then be used to determine the genotype of each patient. The results were as follows: (A) UGT1A1*6 (G/G), ΔST =−2.9896; (B) UGT1A1*6 (G/A), ΔST =−0.7286; (C) UGT1A1*6 (A/A), ΔST =10.6859; (D) UGT1A1*28 (TA6/6), ΔST =−7.2983; (E) UGT1A1*28 (TA6/7), ΔST =0.8421; and (F) UGT1A1*28 (TA7/7), ΔST =14.8599. The maximum value of ΔST is 5. Therefore, the ΔST values of UGT1A1*6 (G/A), UGT1A1*6 (G/G), and UGT1A1*6 (A/A) were between −2.0657 and 5.000, <−2.0657, and >5.000, respectively, and the ΔST values of UGT1A1*28 (TA6/7), UGT1A1*28 (TA6/6), and UGT1A1*6 (TA7/7) were between −3.5868 and 5.000, <−3.5868, and >5.000, respectively.
Abbreviations: DFMH, digital fluorescence molecular hybridization; ST, signal intensity.
Abbreviations: DFMH, digital fluorescence molecular hybridization; ST, signal intensity.
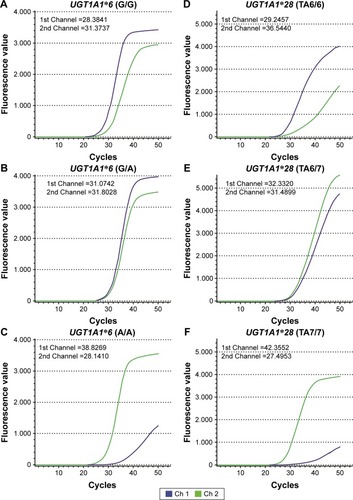
Figure 2 UGT1A1 gene polymorphisms in patients.
Notes: Blood samples from the patients were analyzed by DFMH, and the results are as follows: (A) ΔST =−3.1828, representing UGT1A1*6 (G/G); (B) ΔST =0.4192, representing UGT1A1*6 (G/A); (C) ΔST =12.0046, representing UGT1A1*6 (A/A); (D) ΔST =−6.5741, representing UGT1A1*28 (TA6/6); (E) ΔST =1.6713, representing UGT1A1*28 (TA6/7); and (F) ΔST =5.6336, representing UGT1A1*28 (TA7/7).
Abbreviations: DFMH, digital fluorescence molecular hybridization; ST, signal intensity.
Abbreviations: DFMH, digital fluorescence molecular hybridization; ST, signal intensity.
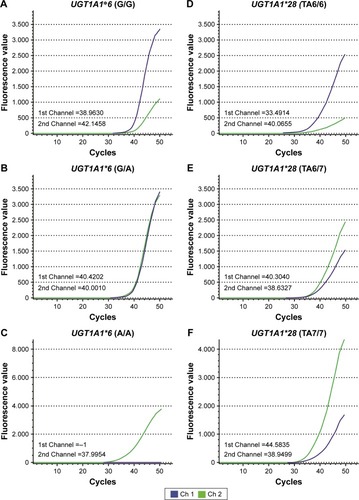
Table 2 Clinical characteristics of patients with irinotecan-based treatment in this study
Table 3 Distribution of UGT1A1 gene polymorphisms
Table 4 Relationship between UGT1A1*6/*28 genotype and the incidence of adverse reactions associated with CPT-11
Table 5 Relationship between UGT1A1*6/*28 genotype and the incidence of adverse reactions associated with different tumors
Table 6 Relationship between UGT1A1 genotype and the incidence of adverse reactions in patients of different ages
Table 7 Relationship between UGT1A1 genotypes and tumor response