Figures & data
Figure 1 Flow of the studies in the meta-analysis.
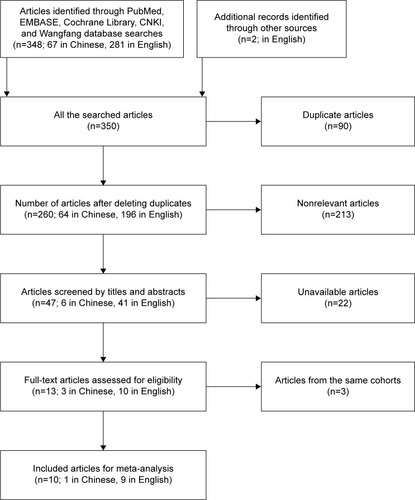
Table 1 Basic data for all included studies in the meta-analysis
Figure 2 Forest plot of association between circulating miR-223 expression and TNM.
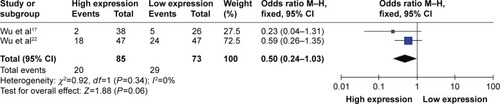
Figure 3 Forest plot showing the association between circulating miR-223 expression and OS. (A) Pooled HR of circulating miR-223 on OS of all types of cancer under random-effects model. In subgroup analyses, (B) pooled HR of circulating miR-223 on OS of chronic lymphocytic leukemia under the fixed-effects model; (C) pooled HR of circulating miR-223 on OS of nonsmall cell lung carcinoma under fixed-effects model; (D) pooled HR of circulating miR-223 on OS of esophageal squamous cell carcinoma under the random-effects model. Data are HRs and 95% CIs.
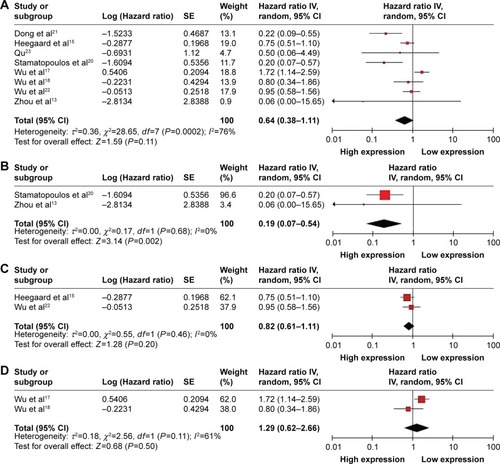
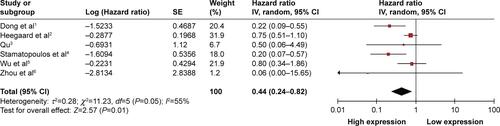
Figure 4 Forest plot of association between circulating miR-223 expression and TFS.
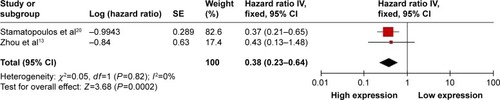
Table 2 Sensitivity analysis for the studies that resulted in loss of significance after omission
Figure 5 Begg’s funnel plot of the association between circulating miR-223 and OS in all cancer types under random-effects model.
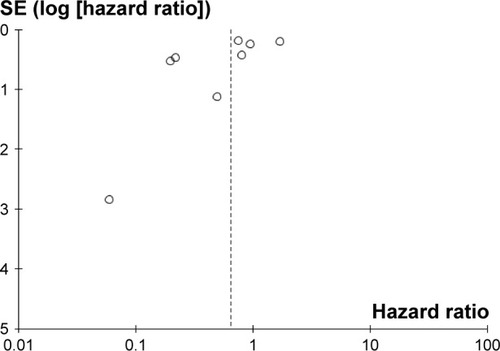
Figure S1 Forest plot of the pooled HRs for OS with esophageal squamous cell carcinoma excluded under the random-effects model.
Abbreviations: HR, hazard ratio; OS, overall survival; IV, inverse variance; CI, confidence interval; SE, standard error.