Figures & data
Figure 1 Flow diagram of the eligible literature search.
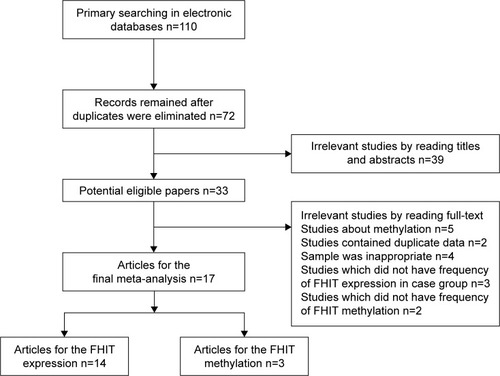
Table 1 Clinicopathological features of eligible studies
Figure 2 Forest plot of the relationship between FHIT expression and liver cancer risk. Note: Weights are from random effects analysis.
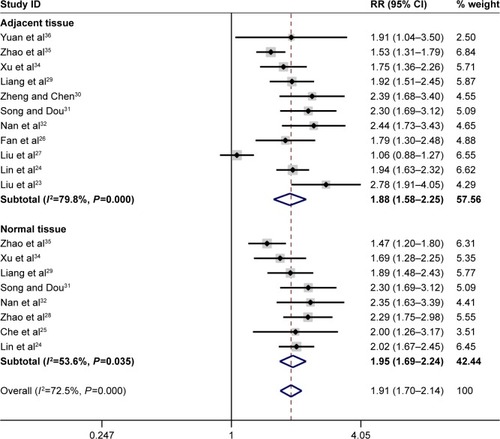
Figure 3 Forest plot of the association between FHIT expression and TNM-stage of liver cancer.
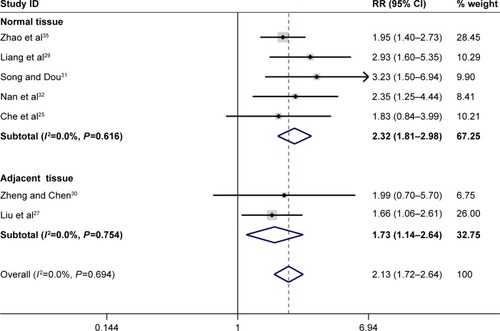
Figure 4 Forest plot of the association between FHIT expression and liver tumor size.
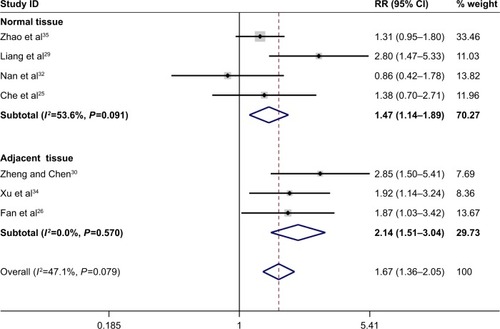
Figure 5 Forest plot of the association between FHIT expression and merging liver cirrhosis into liver cancer.
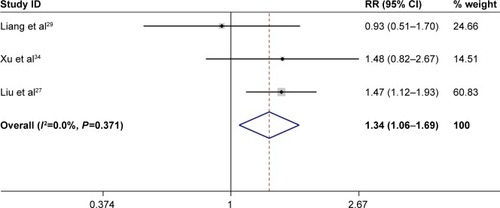
Table 2 Meta-analysis of the associations of FHIT expression and FHIT gene hypermethylation with liver cancer pathogenesis
Figure 6 Forest plot of the association between FHIT gene hypermethylation and liver cancer risk.
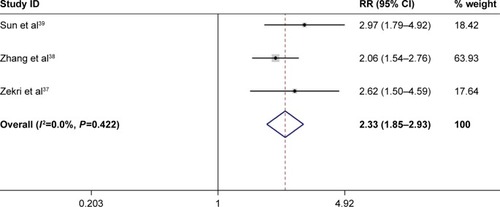
Figure 7 Funnel plot assessing the association of FHIT expression with liver cancer risk.
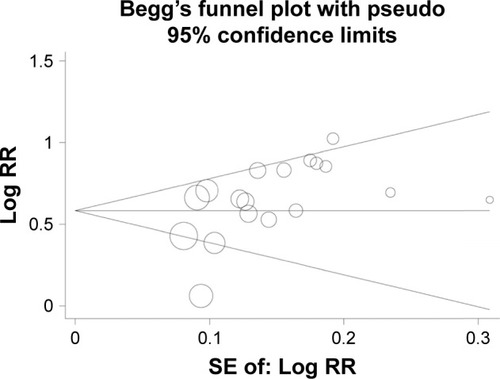
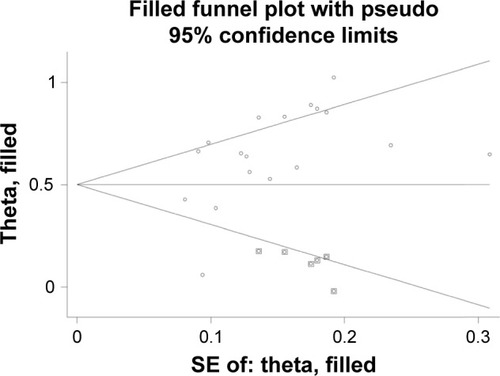
Figure 8 Funnel plot of trim and filling method assessing the association of FHIT expression with liver cancer risk.